
Search for Indicators
Stratified Data
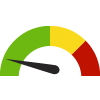
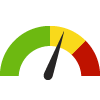
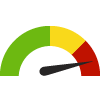
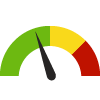
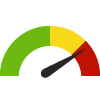
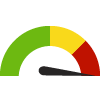
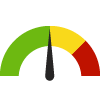
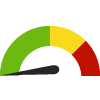
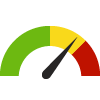
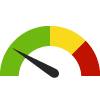
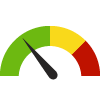
Indicator Gauge Icon Legend
Legend Colors
Red is bad, green is good, blue is not statistically different/neutral.
Compared to Distribution
 the value is in the best half of communities.
 the value is in the 2nd worst quarter of communities.
 the value is in the worst quarter of communities.
Compared to Target
 meets target;
  does not meet target.
Compared to a Single Value
 lower than the comparison value;
 higher than the comparison value;
 not statistically different from comparison value.
Trend

 non-significant change over time;
 significant change over time;
  no change over time.
Compared to Prior Value
 higher than the previous measurement period;
 lower than the previous measurement period;
 no statistically different change from previous measurement period.
 Significantly better than the overall value
 Significantly worse than the overall value
 Significantly different than the overall value
 No significant difference with the overall value
 No data on significance available
Health / Alcohol & Drug Use
Adults who Binge Drink County: Salt Lake
Adults who Binge Drink County: Salt Lake
15.4%
(2020-2022)
Compared to:


UT Counties
The distribution is based on data from 23 Utah counties.
UT Value
(11.8%)
The regional value is compared to the Utah State value.
Prior Value
(6.6%)
Prior Value compares a measured value with the previously measured value. Confidence intervals were taken into account in determining the direction of the comparison.
Trend
This comparison measures the indicator’s values over multiple time periods.<br>The Mann-Kendall Test for Statistical Significance is used to evaluate the trend<br>over 4 to 10 periods of measure, subject to data availability and comparability.
Health / Alcohol & Drug Use
Age-Adjusted Drug and Opioid-Involved Overdose Death Rate
Value
Compared to:
Age-Adjusted Drug and Opioid-Involved Overdose Death Rate County: Salt Lake
Age-Adjusted Drug and Opioid-Involved Overdose Death Rate County: Salt Lake
22.4
Deaths per 100,000 population
(2018-2020)
Compared to:
U.S. Counties
The distribution is based on data from 1,303 U.S. counties and county equivalents.
UT Value
(20.2)
The regional value is compared to the Utah State value.
US Value
(23.5)
The regional value is compared to the national value.
Prior Value
(24.4)
Prior Value compares a measured value with the previously measured value. Confidence intervals were taken into account in determining the direction of the comparison.
Age-Adjusted ER Rate due to Adolescent Alcohol Use County: Salt Lake
Age-Adjusted ER Rate due to Adolescent Alcohol Use County: Salt Lake
6.5
ER visits per 10,000 population aged 10-17
(2020-2022)
Compared to:
UT Value
(6.5)
The regional value is compared to the Utah State value.
Prior Value
(7.1)
Prior Value compares a measured value with the previously measured value. Confidence intervals were taken into account in determining the direction of the comparison.
Trend
This comparison measures the indicator’s values over multiple time periods.<br>The Mann-Kendall Test for Statistical Significance is used to evaluate the trend<br>over 4 to 10 periods of measure, subject to data availability and comparability.
Age-Adjusted ER Rate due to Adult Alcohol Use County: Salt Lake
Age-Adjusted ER Rate due to Adult Alcohol Use County: Salt Lake
38.1
ER visits per 10,000 population 18+ years
(2020-2022)
Compared to:
UT Counties
The distribution is based on data from 25 Utah counties.
UT Value
(32.9)
The regional value is compared to the Utah State value.
Prior Value
(39.5)
Prior Value compares a measured value with the previously measured value. Confidence intervals were taken into account in determining the direction of the comparison.
Trend
This comparison measures the indicator’s values over multiple time periods.<br>The Mann-Kendall Test for Statistical Significance is used to evaluate the trend<br>over 4 to 10 periods of measure, subject to data availability and comparability.
Age-Adjusted ER Rate due to Opioid Use County: Salt Lake
Age-Adjusted ER Rate due to Opioid Use County: Salt Lake
18.9
ER visits per 10,000 population 18+ years
(2020-2022)
Compared to:

UT Counties
The distribution is based on data from 21 Utah counties.
UT Value
(12.6)
The regional value is compared to the Utah State value.
Prior Value
(17.5)
Prior Value compares a measured value with the previously measured value. Confidence intervals were taken into account in determining the direction of the comparison.
Trend
This comparison measures the indicator’s values over multiple time periods.<br>The Mann-Kendall Test for Statistical Significance is used to evaluate the trend<br>over 4 to 10 periods of measure, subject to data availability and comparability.
Age-Adjusted ER Rate due to Substance Use County: Salt Lake
Age-Adjusted ER Rate due to Substance Use County: Salt Lake
40.1
ER visits per 10,000 population 18+ years
(2020-2022)
Compared to:
UT Counties
The distribution is based on data from 25 Utah counties.
UT Value
(26.3)
The regional value is compared to the Utah State value.
Prior Value
(38.7)
Prior Value compares a measured value with the previously measured value. Confidence intervals were taken into account in determining the direction of the comparison.
Trend
This comparison measures the indicator’s values over multiple time periods.<br>The Mann-Kendall Test for Statistical Significance is used to evaluate the trend<br>over 4 to 10 periods of measure, subject to data availability and comparability.
Health / Alcohol & Drug Use
Age-Adjusted Hospitalization Rate due to Adolescent Alcohol Use
Value
Compared to:
Age-Adjusted Hospitalization Rate due to Adolescent Alcohol Use County: Salt Lake
Age-Adjusted Hospitalization Rate due to Adolescent Alcohol Use County: Salt Lake
2.1
Hospitalizations per 10,000 population aged 10-17
(2020-2022)
Compared to:
UT Value
(2.2)
The regional value is compared to the Utah State value.
Prior Value
(2.2)
Prior Value compares a measured value with the previously measured value. Confidence intervals were taken into account in determining the direction of the comparison.
Trend
This comparison measures the indicator’s values over multiple time periods.<br>The Mann-Kendall Test for Statistical Significance is used to evaluate the trend<br>over 4 to 10 periods of measure, subject to data availability and comparability.
Health / Alcohol & Drug Use
Age-Adjusted Hospitalization Rate due to Adult Alcohol Use
Value
Compared to:
Age-Adjusted Hospitalization Rate due to Adult Alcohol Use County: Salt Lake
Age-Adjusted Hospitalization Rate due to Adult Alcohol Use County: Salt Lake
24.1
Hospitalizations per 10,000 population 18+ years
(2020-2022)
Compared to:
UT Counties
The distribution is based on data from 25 Utah counties.
UT Value
(21.0)
The regional value is compared to the Utah State value.
Prior Value
(23.7)
Prior Value compares a measured value with the previously measured value. Confidence intervals were taken into account in determining the direction of the comparison.
Trend
This comparison measures the indicator’s values over multiple time periods.<br>The Mann-Kendall Test for Statistical Significance is used to evaluate the trend<br>over 4 to 10 periods of measure, subject to data availability and comparability.
Age-Adjusted Hospitalization Rate due to Opioid Use County: Salt Lake
Age-Adjusted Hospitalization Rate due to Opioid Use County: Salt Lake
4.9
Hospitalizations per 10,000 population 18+ years
(2020-2022)
Compared to:
UT Value
(5.5)
The regional value is compared to the Utah State value.
Prior Value
(5.6)
Prior Value compares a measured value with the previously measured value. Confidence intervals were taken into account in determining the direction of the comparison.
Trend
This comparison measures the indicator’s values over multiple time periods.<br>The Mann-Kendall Test for Statistical Significance is used to evaluate the trend<br>over 4 to 10 periods of measure, subject to data availability and comparability.
Health / Alcohol & Drug Use
Age-Adjusted Hospitalization Rate due to Substance Use
Value
Compared to:
Age-Adjusted Hospitalization Rate due to Substance Use County: Salt Lake
Age-Adjusted Hospitalization Rate due to Substance Use County: Salt Lake
7.7
Hospitalizations per 10,000 population 18+ years
(2020-2022)
Compared to:
UT Counties
The distribution is based on data from 20 Utah counties.
UT Value
(7.5)
The regional value is compared to the Utah State value.
Prior Value
(8.4)
Prior Value compares a measured value with the previously measured value. Confidence intervals were taken into account in determining the direction of the comparison.
Trend
This comparison measures the indicator’s values over multiple time periods.<br>The Mann-Kendall Test for Statistical Significance is used to evaluate the trend<br>over 4 to 10 periods of measure, subject to data availability and comparability.
Death Rate due to Drug Poisoning County: Salt Lake
Death Rate due to Drug Poisoning County: Salt Lake
22.7
Deaths per 100,000 population
(2019-2021)
Compared to:
U.S. Counties
The distribution is based on data from 1,899 U.S. counties and county equivalents.
UT Value
(18.9)
The regional value is compared to the Utah State value.
US Value
(27.2)
The regional value is compared to the national value.
HP 2030 Target
(20.7)
<div>SU-03: Reduce drug overdose deaths <strong>(LEADING HEALTH INDICATOR)</strong></div>
Health / Cancer
Age-Adjusted Death Rate due to Breast Cancer County: Salt Lake
Age-Adjusted Death Rate due to Breast Cancer County: Salt Lake
21.4
Deaths per 100,000 females
(2016-2020)
Compared to:
U.S. Counties
The distribution is based on data from 1,755 U.S. counties and county equivalents.
UT Value
(19.8)
The regional value is compared to the Utah State value.
US Value
(19.6)
The regional value is compared to the national value.
Prior Value
(22.2)
Prior Value compares a measured value with the previously measured value. Confidence intervals were taken into account in determining the direction of the comparison.
Trend
This comparison measures the indicator’s values over multiple time periods.<br>The Mann-Kendall Test for Statistical Significance is used to evaluate the trend<br>over 4 to 10 periods of measure, subject to data availability and comparability.
HP 2030 Target
(15.3)
Age-Adjusted Death Rate due to Cancer County: Salt Lake
Age-Adjusted Death Rate due to Cancer County: Salt Lake
125.5
Deaths per 100,000 population
(2016-2020)
Compared to:
UT Counties
The distribution is based on data from 27 Utah counties.
U.S. Counties
The distribution is based on data from 3,085 U.S. counties and county equivalents.
UT Value
(120.6)
The regional value is compared to the Utah State value.
US Value
(149.4)
The regional value is compared to the national value.
Prior Value
(127.7)
Prior Value compares a measured value with the previously measured value. Confidence intervals were taken into account in determining the direction of the comparison.
Trend
This comparison measures the indicator’s values over multiple time periods.<br>The Mann-Kendall Test for Statistical Significance is used to evaluate the trend<br>over 4 to 10 periods of measure, subject to data availability and comparability.
HP 2030 Target
(122.7)
Age-Adjusted Death Rate due to Colorectal Cancer County: Salt Lake
Age-Adjusted Death Rate due to Colorectal Cancer County: Salt Lake
10.7
Deaths per 100,000 population
(2016-2020)
Compared to:
U.S. Counties
The distribution is based on data from 2,174 U.S. counties and county equivalents.
UT Value
(10.6)
The regional value is compared to the Utah State value.
US Value
(13.1)
The regional value is compared to the national value.
Prior Value
(11.2)
Prior Value compares a measured value with the previously measured value. Confidence intervals were taken into account in determining the direction of the comparison.
Trend
This comparison measures the indicator’s values over multiple time periods.<br>The Mann-Kendall Test for Statistical Significance is used to evaluate the trend<br>over 4 to 10 periods of measure, subject to data availability and comparability.
HP 2030 Target
(8.9)
Age-Adjusted Death Rate due to Lung Cancer County: Salt Lake
Age-Adjusted Death Rate due to Lung Cancer County: Salt Lake
17.8
Deaths per 100,000 population
(2016-2020)
Compared to:
UT Counties
The distribution is based on data from 20 Utah counties.
U.S. Counties
The distribution is based on data from 2,752 U.S. counties and county equivalents.
UT Value
(16.6)
The regional value is compared to the Utah State value.
US Value
(35.0)
The regional value is compared to the national value.
Prior Value
(18.5)
Prior Value compares a measured value with the previously measured value. Confidence intervals were taken into account in determining the direction of the comparison.
Trend
This comparison measures the indicator’s values over multiple time periods.<br>The Mann-Kendall Test for Statistical Significance is used to evaluate the trend<br>over 4 to 10 periods of measure, subject to data availability and comparability.
HP 2030 Target
(25.1)
Age-Adjusted Death Rate due to Prostate Cancer County: Salt Lake
Age-Adjusted Death Rate due to Prostate Cancer County: Salt Lake
22.3
Deaths per 100,000 males
(2016-2020)
Compared to:
U.S. Counties
The distribution is based on data from 1,576 U.S. counties and county equivalents.
UT Value
(21.8)
The regional value is compared to the Utah State value.
US Value
(18.8)
The regional value is compared to the national value.
Prior Value
(21.3)
Prior Value compares a measured value with the previously measured value. Confidence intervals were taken into account in determining the direction of the comparison.
Trend
This comparison measures the indicator’s values over multiple time periods.<br>The Mann-Kendall Test for Statistical Significance is used to evaluate the trend<br>over 4 to 10 periods of measure, subject to data availability and comparability.
HP 2030 Target
(16.9)
All Cancer Incidence Rate County: Salt Lake
All Cancer Incidence Rate County: Salt Lake
399.8
Cases per 100,000 population
(2016-2020)
Compared to:
UT Counties
The distribution is based on data from 29 Utah counties.
U.S. Counties
The distribution is based on data from 2,693 U.S. counties and county equivalents.
UT Value
(403.0)
The regional value is compared to the Utah State value.
US Value
(442.3)
The regional value is compared to the national value.
Prior Value
(407.0)
Prior Value compares a measured value with the previously measured value. Confidence intervals were taken into account in determining the direction of the comparison.
Trend
This comparison measures the indicator’s values over multiple time periods.<br>The Mann-Kendall Test for Statistical Significance is used to evaluate the trend<br>over 4 to 10 periods of measure, subject to data availability and comparability.
Breast Cancer Incidence Rate County: Salt Lake
Breast Cancer Incidence Rate County: Salt Lake
120.3
Cases per 100,000 females
(2016-2020)
Compared to:
UT Counties
The distribution is based on data from 24 Utah counties.
U.S. Counties
The distribution is based on data from 2,478 U.S. counties and county equivalents.
UT Value
(115.5)
The regional value is compared to the Utah State value.
US Value
(127.0)
The regional value is compared to the national value.
Prior Value
(121.0)
Prior Value compares a measured value with the previously measured value. Confidence intervals were taken into account in determining the direction of the comparison.
Trend
This comparison measures the indicator’s values over multiple time periods.<br>The Mann-Kendall Test for Statistical Significance is used to evaluate the trend<br>over 4 to 10 periods of measure, subject to data availability and comparability.
Cancer: Medicare Population County: Salt Lake
Cancer: Medicare Population County: Salt Lake
10.0%
(2022)
Compared to:
UT Counties
The distribution is based on data from 29 Utah counties.
U.S. Counties
The distribution is based on data from 3,129 U.S. counties and county equivalents.
UT Value
(10.0%)
The regional value is compared to the Utah State value.
US Value
(12.0%)
The regional value is compared to the national value.
Prior Value
(9.0%)
Prior Value compares a measured value with the previously measured value. Confidence intervals were not taken into account in determining the direction of the comparison.
Trend
This comparison measures the indicator’s values over multiple time periods.<br>The Mann-Kendall Test for Statistical Significance is used to evaluate the trend<br>over 4 to 10 periods of measure, subject to data availability and comparability.
Cervical Cancer Incidence Rate County: Salt Lake
Cervical Cancer Incidence Rate County: Salt Lake
6.2
Cases per 100,000 females
(2016-2020)
Compared to:
U.S. Counties
The distribution is based on data from 696 U.S. counties and county equivalents.
UT Value
(5.8)
The regional value is compared to the Utah State value.
US Value
(7.5)
The regional value is compared to the national value.
Prior Value
(6.0)
Prior Value compares a measured value with the previously measured value. Confidence intervals were taken into account in determining the direction of the comparison.
Trend
This comparison measures the indicator’s values over multiple time periods.<br>The Mann-Kendall Test for Statistical Significance is used to evaluate the trend<br>over 4 to 10 periods of measure, subject to data availability and comparability.
Colon Cancer Screening: USPSTF Recommendation County: Salt Lake
Colon Cancer Screening: USPSTF Recommendation County: Salt Lake
75.2%
(2018-2020)
Compared to:
UT Counties
The distribution is based on data from 24 Utah counties.
UT Value
(73.1%)
The regional value is compared to the Utah State value.
Prior Value
(71.5%)
Prior Value compares a measured value with the previously measured value. Confidence intervals were taken into account in determining the direction of the comparison.
Trend
This comparison measures the indicator’s values over multiple time periods.<br>The Mann-Kendall Test for Statistical Significance is used to evaluate the trend<br>over 4 to 10 periods of measure, subject to data availability and comparability.
Colorectal Cancer Incidence Rate County: Salt Lake
Colorectal Cancer Incidence Rate County: Salt Lake
28.7
Cases per 100,000 population
(2016-2020)
Compared to:
UT Counties
The distribution is based on data from 22 Utah counties.
U.S. Counties
The distribution is based on data from 2,401 U.S. counties and county equivalents.
UT Value
(28.8)
The regional value is compared to the Utah State value.
US Value
(36.5)
The regional value is compared to the national value.
Prior Value
(28.3)
Prior Value compares a measured value with the previously measured value. Confidence intervals were taken into account in determining the direction of the comparison.
Trend
This comparison measures the indicator’s values over multiple time periods.<br>The Mann-Kendall Test for Statistical Significance is used to evaluate the trend<br>over 4 to 10 periods of measure, subject to data availability and comparability.
Lung and Bronchus Cancer Incidence Rate County: Salt Lake
Lung and Bronchus Cancer Incidence Rate County: Salt Lake
27.5
Cases per 100,000 population
(2016-2020)
Compared to:
UT Counties
The distribution is based on data from 22 Utah counties.
U.S. Counties
The distribution is based on data from 2,471 U.S. counties and county equivalents.
UT Value
(24.9)
The regional value is compared to the Utah State value.
US Value
(54.0)
The regional value is compared to the national value.
Prior Value
(29.2)
Prior Value compares a measured value with the previously measured value. Confidence intervals were taken into account in determining the direction of the comparison.
Trend
This comparison measures the indicator’s values over multiple time periods.<br>The Mann-Kendall Test for Statistical Significance is used to evaluate the trend<br>over 4 to 10 periods of measure, subject to data availability and comparability.
Mammogram in Past 2 Years: 40+ County: Salt Lake
Mammogram in Past 2 Years: 40+ County: Salt Lake
63.9%
(2018-2020)
Compared to:


UT Counties
The distribution is based on data from 24 Utah counties.
UT Value
(64.2% in 2018)
The regional value is compared to the Utah State value.
Prior Value
(68.6%)
Prior Value compares a measured value with the previously measured value. Confidence intervals were taken into account in determining the direction of the comparison.
Trend
This comparison measures the indicator’s values over multiple time periods.<br>The Mann-Kendall Test for Statistical Significance is used to evaluate the trend<br>over 4 to 10 periods of measure, subject to data availability and comparability.
Mammography Screening: Medicare Population County: Salt Lake
Mammography Screening: Medicare Population County: Salt Lake
44.0%
(2022)
Compared to:
UT Counties
The distribution is based on data from 29 Utah counties.
U.S. Counties
The distribution is based on data from 3,123 U.S. counties and county equivalents.
UT Value
(45.0%)
The regional value is compared to the Utah State value.
US Value
(47.0%)
The regional value is compared to the national value.
Prior Value
(43.0%)
Prior Value compares a measured value with the previously measured value. Confidence intervals were not taken into account in determining the direction of the comparison.
Trend
This comparison measures the indicator’s values over multiple time periods.<br>The Mann-Kendall Test for Statistical Significance is used to evaluate the trend<br>over 4 to 10 periods of measure, subject to data availability and comparability.
Melanoma Incidence Rate County: Salt Lake
Melanoma Incidence Rate County: Salt Lake
38.3
Cases per 100,000 population
(2016-2020)
Compared to:
UT Counties
The distribution is based on data from 23 Utah counties.
U.S. Counties
The distribution is based on data from 1,961 U.S. counties and county equivalents.
UT Value
(40.8)
The regional value is compared to the Utah State value.
US Value
(22.5)
The regional value is compared to the national value.
Prior Value
(39.6)
Prior Value compares a measured value with the previously measured value. Confidence intervals were taken into account in determining the direction of the comparison.
Trend
This comparison measures the indicator’s values over multiple time periods.<br>The Mann-Kendall Test for Statistical Significance is used to evaluate the trend<br>over 4 to 10 periods of measure, subject to data availability and comparability.
Oral Cavity and Pharynx Cancer Incidence Rate County: Salt Lake
Oral Cavity and Pharynx Cancer Incidence Rate County: Salt Lake
9.6
Cases per 100,000 population
(2016-2020)
Compared to:
U.S. Counties
The distribution is based on data from 1,706 U.S. counties and county equivalents.
UT Value
(9.5)
The regional value is compared to the Utah State value.
US Value
(11.9)
The regional value is compared to the national value.
Prior Value
(10.3)
Prior Value compares a measured value with the previously measured value. Confidence intervals were taken into account in determining the direction of the comparison.
Trend
This comparison measures the indicator’s values over multiple time periods.<br>The Mann-Kendall Test for Statistical Significance is used to evaluate the trend<br>over 4 to 10 periods of measure, subject to data availability and comparability.
Prostate Cancer Incidence Rate County: Salt Lake
Prostate Cancer Incidence Rate County: Salt Lake
103.1
Cases per 100,000 males
(2016-2020)
Compared to:
UT Counties
The distribution is based on data from 25 Utah counties.
U.S. Counties
The distribution is based on data from 2,500 U.S. counties and county equivalents.
UT Value
(117.4)
The regional value is compared to the Utah State value.
US Value
(110.5)
The regional value is compared to the national value.
Prior Value
(101.8)
Prior Value compares a measured value with the previously measured value. Confidence intervals were taken into account in determining the direction of the comparison.
Trend
This comparison measures the indicator’s values over multiple time periods.<br>The Mann-Kendall Test for Statistical Significance is used to evaluate the trend<br>over 4 to 10 periods of measure, subject to data availability and comparability.
Health / Diabetes
Adults with Diabetes County: Salt Lake
Adults with Diabetes County: Salt Lake
9.1%
(2020-2022)
Compared to:
UT Counties
The distribution is based on data from 26 Utah counties.
UT Value
(8.7%)
The regional value is compared to the Utah State value.
Prior Value
(9.0%)
Prior Value compares a measured value with the previously measured value. Confidence intervals were taken into account in determining the direction of the comparison.
Trend
This comparison measures the indicator’s values over multiple time periods.<br>The Mann-Kendall Test for Statistical Significance is used to evaluate the trend<br>over 4 to 10 periods of measure, subject to data availability and comparability.
Age-Adjusted Death Rate due to Diabetes County: Salt Lake
Age-Adjusted Death Rate due to Diabetes County: Salt Lake
28.6
Deaths per 100,000 population
(2019-2021)
Compared to:
UT Value
(26.9)
The regional value is compared to the Utah State value.
US Value
(24.8 in 2020)
The regional value is compared to the national value. The source for the national value is Centers for Disease Control and Prevention
Prior Value
(26.9)
Prior Value compares a measured value with the previously measured value. Confidence intervals were taken into account in determining the direction of the comparison.
Trend
This comparison measures the indicator’s values over multiple time periods.<br>The Mann-Kendall Test for Statistical Significance is used to evaluate the trend<br>over 4 to 10 periods of measure, subject to data availability and comparability.
Age-Adjusted ER Rate due to Diabetes County: Salt Lake
Age-Adjusted ER Rate due to Diabetes County: Salt Lake
18.6
ER visits per 10,000 population 18+ years
(2020-2022)
Compared to:
UT Counties
The distribution is based on data from 24 Utah counties.
UT Value
(18.6)
The regional value is compared to the Utah State value.
Prior Value
(18.2)
Prior Value compares a measured value with the previously measured value. Confidence intervals were taken into account in determining the direction of the comparison.
Trend
This comparison measures the indicator’s values over multiple time periods.<br>The Mann-Kendall Test for Statistical Significance is used to evaluate the trend<br>over 4 to 10 periods of measure, subject to data availability and comparability.
Health / Diabetes
Age-Adjusted ER Rate due to Long-Term Complications of Diabetes
Value
Compared to:
Age-Adjusted ER Rate due to Long-Term Complications of Diabetes County: Salt Lake
Age-Adjusted ER Rate due to Long-Term Complications of Diabetes County: Salt Lake
4.1
ER visits per 10,000 population 18+ years
(2020-2022)
Compared to:
UT Value
(4.0)
The regional value is compared to the Utah State value.
Prior Value
(4.2)
Prior Value compares a measured value with the previously measured value. Confidence intervals were taken into account in determining the direction of the comparison.
Trend
This comparison measures the indicator’s values over multiple time periods.<br>The Mann-Kendall Test for Statistical Significance is used to evaluate the trend<br>over 4 to 10 periods of measure, subject to data availability and comparability.
Health / Diabetes
Age-Adjusted ER Rate due to Short-Term Complications of Diabetes
Value
Compared to:
Age-Adjusted ER Rate due to Short-Term Complications of Diabetes County: Salt Lake
Age-Adjusted ER Rate due to Short-Term Complications of Diabetes County: Salt Lake
1.1
ER visits per 10,000 population 18+ years
(2020-2022)
Compared to:
UT Value
(1.2)
The regional value is compared to the Utah State value.
Prior Value
(1.2)
Prior Value compares a measured value with the previously measured value. Confidence intervals were taken into account in determining the direction of the comparison.
Trend
This comparison measures the indicator’s values over multiple time periods.<br>The Mann-Kendall Test for Statistical Significance is used to evaluate the trend<br>over 4 to 10 periods of measure, subject to data availability and comparability.
Age-Adjusted ER Rate due to Type 2 Diabetes County: Salt Lake
Age-Adjusted ER Rate due to Type 2 Diabetes County: Salt Lake
15.0
ER visits per 10,000 population 18+ years
(2020-2022)
Compared to:
UT Counties
The distribution is based on data from 24 Utah counties.
UT Value
(14.6)
The regional value is compared to the Utah State value.
Prior Value
(14.7)
Prior Value compares a measured value with the previously measured value. Confidence intervals were taken into account in determining the direction of the comparison.
Trend
This comparison measures the indicator’s values over multiple time periods.<br>The Mann-Kendall Test for Statistical Significance is used to evaluate the trend<br>over 4 to 10 periods of measure, subject to data availability and comparability.
Age-Adjusted ER Rate due to Uncontrolled Diabetes County: Salt Lake
Age-Adjusted ER Rate due to Uncontrolled Diabetes County: Salt Lake
12.6
ER visits per 10,000 population 18+ years
(2020-2022)
Compared to:
UT Counties
The distribution is based on data from 23 Utah counties.
UT Value
(12.6)
The regional value is compared to the Utah State value.
Prior Value
(12.1)
Prior Value compares a measured value with the previously measured value. Confidence intervals were taken into account in determining the direction of the comparison.
Trend
This comparison measures the indicator’s values over multiple time periods.<br>The Mann-Kendall Test for Statistical Significance is used to evaluate the trend<br>over 4 to 10 periods of measure, subject to data availability and comparability.
Age-Adjusted Hospitalization Rate due to Diabetes County: Salt Lake
Age-Adjusted Hospitalization Rate due to Diabetes County: Salt Lake
13.4
Hospitalizations per 10,000 population 18+ years
(2020-2022)
Compared to:
UT Counties
The distribution is based on data from 24 Utah counties.
UT Value
(12.8)
The regional value is compared to the Utah State value.
Prior Value
(13.1)
Prior Value compares a measured value with the previously measured value. Confidence intervals were taken into account in determining the direction of the comparison.
Trend
This comparison measures the indicator’s values over multiple time periods.<br>The Mann-Kendall Test for Statistical Significance is used to evaluate the trend<br>over 4 to 10 periods of measure, subject to data availability and comparability.
Health / Diabetes
Age-Adjusted Hospitalization Rate due to Long-Term Complications of Diabetes
Value
Compared to:
Age-Adjusted Hospitalization Rate due to Long-Term Complications of Diabetes County: Salt Lake
Age-Adjusted Hospitalization Rate due to Long-Term Complications of Diabetes County: Salt Lake
5.1
Hospitalizations per 10,000 population 18+ years
(2020-2022)
Compared to:
UT Value
(4.8)
The regional value is compared to the Utah State value.
Prior Value
(4.8)
Prior Value compares a measured value with the previously measured value. Confidence intervals were taken into account in determining the direction of the comparison.
Trend
This comparison measures the indicator’s values over multiple time periods.<br>The Mann-Kendall Test for Statistical Significance is used to evaluate the trend<br>over 4 to 10 periods of measure, subject to data availability and comparability.
Health / Diabetes
Age-Adjusted Hospitalization Rate due to Short-Term Complications of Diabetes
Value
Compared to:
Age-Adjusted Hospitalization Rate due to Short-Term Complications of Diabetes County: Salt Lake
Age-Adjusted Hospitalization Rate due to Short-Term Complications of Diabetes County: Salt Lake
6.7
Hospitalizations per 10,000 population 18+ years
(2020-2022)
Compared to:
UT Value
(6.4)
The regional value is compared to the Utah State value.
Prior Value
(6.7)
Prior Value compares a measured value with the previously measured value. Confidence intervals were taken into account in determining the direction of the comparison.
Trend
This comparison measures the indicator’s values over multiple time periods.<br>The Mann-Kendall Test for Statistical Significance is used to evaluate the trend<br>over 4 to 10 periods of measure, subject to data availability and comparability.
Age-Adjusted Hospitalization Rate due to Type 2 Diabetes County: Salt Lake
Age-Adjusted Hospitalization Rate due to Type 2 Diabetes County: Salt Lake
8.7
Hospitalizations per 10,000 population 18+ years
(2020-2022)
Compared to:
UT Counties
The distribution is based on data from 22 Utah counties.
UT Value
(8.1)
The regional value is compared to the Utah State value.
Prior Value
(8.3)
Prior Value compares a measured value with the previously measured value. Confidence intervals were taken into account in determining the direction of the comparison.
Trend
This comparison measures the indicator’s values over multiple time periods.<br>The Mann-Kendall Test for Statistical Significance is used to evaluate the trend<br>over 4 to 10 periods of measure, subject to data availability and comparability.
Age-Adjusted Hospitalization Rate due to Uncontrolled Diabetes County: Salt Lake
Age-Adjusted Hospitalization Rate due to Uncontrolled Diabetes County: Salt Lake
1.7
Hospitalizations per 10,000 population 18+ years
(2020-2022)
Compared to:
UT Value
(1.6)
The regional value is compared to the Utah State value.
Prior Value
(1.6)
Prior Value compares a measured value with the previously measured value. Confidence intervals were taken into account in determining the direction of the comparison.
Trend
This comparison measures the indicator’s values over multiple time periods.<br>The Mann-Kendall Test for Statistical Significance is used to evaluate the trend<br>over 4 to 10 periods of measure, subject to data availability and comparability.
Diabetes: Medicare Population County: Salt Lake
Diabetes: Medicare Population County: Salt Lake
23.0%
(2022)
Compared to:
UT Counties
The distribution is based on data from 29 Utah counties.
U.S. Counties
The distribution is based on data from 3,129 U.S. counties and county equivalents.
UT Value
(23.0%)
The regional value is compared to the Utah State value.
US Value
(24.0%)
The regional value is compared to the national value.
Prior Value
(23.0%)
Prior Value compares a measured value with the previously measured value. Confidence intervals were not taken into account in determining the direction of the comparison.
Trend
This comparison measures the indicator’s values over multiple time periods.<br>The Mann-Kendall Test for Statistical Significance is used to evaluate the trend<br>over 4 to 10 periods of measure, subject to data availability and comparability.
Health / Disabilities
Children with a Disability County: Salt Lake
Children with a Disability County: Salt Lake
4.2%
(2018-2022)
Compared to:


UT Value
(3.8%)
The regional value is compared to the Utah State value.
US Value
(4.5%)
The regional value is compared to the national value.
Trend
This comparison measures the indicator’s values over multiple time periods.<br>The Mann-Kendall Test for Statistical Significance is used to evaluate the trend<br>over 4 to 10 periods of measure, subject to data availability and comparability.
Persons with a Cognitive Difficulty County: Salt Lake
Persons with a Cognitive Difficulty County: Salt Lake
4.8%
(2018-2022)
Compared to:
UT Value
(4.7%)
The regional value is compared to the Utah State value.
US Value
(5.3%)
The regional value is compared to the national value.
Trend
This comparison measures the indicator’s values over multiple time periods.<br>The Mann-Kendall Test for Statistical Significance is used to evaluate the trend<br>over 4 to 10 periods of measure, subject to data availability and comparability.
Persons with a Disability County: Salt Lake
Persons with a Disability County: Salt Lake
9.9%
(2018-2022)
Compared to:
UT Value
(10.0%)
The regional value is compared to the Utah State value.
US Value
(12.9%)
The regional value is compared to the national value.
Trend
This comparison measures the indicator’s values over multiple time periods.<br>The Mann-Kendall Test for Statistical Significance is used to evaluate the trend<br>over 4 to 10 periods of measure, subject to data availability and comparability.
Persons with a Hearing Difficulty County: Salt Lake
Persons with a Hearing Difficulty County: Salt Lake
2.7%
(2018-2022)
Compared to:

UT Value
(2.9%)
The regional value is compared to the Utah State value.
US Value
(3.6%)
The regional value is compared to the national value.
Trend
This comparison measures the indicator’s values over multiple time periods.<br>The Mann-Kendall Test for Statistical Significance is used to evaluate the trend<br>over 4 to 10 periods of measure, subject to data availability and comparability.
Persons with a Self-Care Difficulty County: Salt Lake
Persons with a Self-Care Difficulty County: Salt Lake
1.7%
(2018-2022)
Compared to:

UT Value
(1.6%)
The regional value is compared to the Utah State value.
US Value
(2.6%)
The regional value is compared to the national value.
Trend
This comparison measures the indicator’s values over multiple time periods.<br>The Mann-Kendall Test for Statistical Significance is used to evaluate the trend<br>over 4 to 10 periods of measure, subject to data availability and comparability.
Persons with a Vision Difficulty County: Salt Lake
Persons with a Vision Difficulty County: Salt Lake
1.7%
(2018-2022)
Compared to:
UT Value
(1.6%)
The regional value is compared to the Utah State value.
US Value
(2.4%)
The regional value is compared to the national value.
Trend
This comparison measures the indicator’s values over multiple time periods.<br>The Mann-Kendall Test for Statistical Significance is used to evaluate the trend<br>over 4 to 10 periods of measure, subject to data availability and comparability.
Persons with an Ambulatory Difficulty County: Salt Lake
Persons with an Ambulatory Difficulty County: Salt Lake
4.3%
(2018-2022)
Compared to:

UT Value
(4.2%)
The regional value is compared to the Utah State value.
US Value
(6.7%)
The regional value is compared to the national value.
Trend
This comparison measures the indicator’s values over multiple time periods.<br>The Mann-Kendall Test for Statistical Significance is used to evaluate the trend<br>over 4 to 10 periods of measure, subject to data availability and comparability.
Health / Health Care Access & Quality
Adults Unable to Afford to See a Doctor County: Salt Lake
Adults Unable to Afford to See a Doctor County: Salt Lake
11.6%
(2020-2022)
Compared to:
UT Counties
The distribution is based on data from 26 Utah counties.
UT Value
(10.7%)
The regional value is compared to the Utah State value.
Prior Value
(12.8%)
Prior Value compares a measured value with the previously measured value. Confidence intervals were taken into account in determining the direction of the comparison.
Trend
This comparison measures the indicator’s values over multiple time periods.<br>The Mann-Kendall Test for Statistical Significance is used to evaluate the trend<br>over 4 to 10 periods of measure, subject to data availability and comparability.
Adults with a Usual Source of Health Care County: Salt Lake
Adults with a Usual Source of Health Care County: Salt Lake
77.8%
(2020-2022)
Compared to:
UT Counties
The distribution is based on data from 29 Utah counties.
UT Value
(78.7%)
The regional value is compared to the Utah State value.
Prior Value
(75.8%)
Prior Value compares a measured value with the previously measured value. Confidence intervals were taken into account in determining the direction of the comparison.
Trend
This comparison measures the indicator’s values over multiple time periods.<br>The Mann-Kendall Test for Statistical Significance is used to evaluate the trend<br>over 4 to 10 periods of measure, subject to data availability and comparability.
Adults with Health Insurance County: Salt Lake
Adults with Health Insurance County: Salt Lake
87.7%
(2022)
Compared to:
U.S. Counties
The distribution is based on data from 828 U.S. counties and county equivalents.
UT Value
(89.4%)
The regional value is compared to the Utah State value.
US Value
(88.7%)
The regional value is compared to the national value.
Prior Value
(88.0%)
Prior Value compares a measured value with the previously measured value. Confidence intervals were taken into account in determining the direction of the comparison.
Trend
This comparison measures the indicator’s values over multiple time periods.<br>The Mann-Kendall Test for Statistical Significance is used to evaluate the trend<br>over 4 to 10 periods of measure, subject to data availability and comparability.
Children with Health Insurance County: Salt Lake
Children with Health Insurance County: Salt Lake
92.5%
(2022)
Compared to:
U.S. Counties
The distribution is based on data from 828 U.S. counties and county equivalents.
UT Value
(93.9%)
The regional value is compared to the Utah State value.
US Value
(94.9%)
The regional value is compared to the national value.
Prior Value
(91.0%)
Prior Value compares a measured value with the previously measured value. Confidence intervals were taken into account in determining the direction of the comparison.
Trend
This comparison measures the indicator’s values over multiple time periods.<br>The Mann-Kendall Test for Statistical Significance is used to evaluate the trend<br>over 4 to 10 periods of measure, subject to data availability and comparability.
Persons with Health Insurance County: Salt Lake
Persons with Health Insurance County: Salt Lake
89.0%
(2021)
Compared to:
UT Counties
The distribution is based on data from 29 Utah counties.
U.S. Counties
The distribution is based on data from 3,140 U.S. counties and county equivalents.
UT Value
(89.9%)
The regional value is compared to the Utah State value.
Prior Value
(90.0%)
Prior Value compares a measured value with the previously measured value. Confidence intervals were taken into account in determining the direction of the comparison.
Trend
This comparison measures the indicator’s values over multiple time periods.<br>The Mann-Kendall Test for Statistical Significance is used to evaluate the trend<br>over 4 to 10 periods of measure, subject to data availability and comparability.
HP 2030 Target
(92.4%)
<div>AHS-01: Increase the proportion of people with health insurance <strong>(LEADING HEALTH INDICATOR)</strong></div>
Persons with Private Health Insurance Only County: Salt Lake
Persons with Private Health Insurance Only County: Salt Lake
68.7%
(2022)
Compared to:

UT Value
(69.7%)
The regional value is compared to the Utah State value.
US Value
(54.8%)
The regional value is compared to the national value.
Prior Value
(68.8%)
Prior Value compares a measured value with the previously measured value. Confidence intervals were not taken into account in determining the direction of the comparison.
Trend
This comparison measures the indicator’s values over multiple time periods.<br>The Mann-Kendall Test for Statistical Significance is used to evaluate the trend<br>over 4 to 10 periods of measure, subject to data availability and comparability.
Persons with Public Health Insurance Only County: Salt Lake
Persons with Public Health Insurance Only County: Salt Lake
14.1%
(2022)
Compared to:

UT Value
(13.4%)
The regional value is compared to the Utah State value.
US Value
(24.8%)
The regional value is compared to the national value.
Prior Value
(13.6%)
Prior Value compares a measured value with the previously measured value. Confidence intervals were not taken into account in determining the direction of the comparison.
Trend
This comparison measures the indicator’s values over multiple time periods.<br>The Mann-Kendall Test for Statistical Significance is used to evaluate the trend<br>over 4 to 10 periods of measure, subject to data availability and comparability.
Health / Health Care Access & Quality
Preventable Hospital Stays: Medicare Population
Value
Compared to:
Preventable Hospital Stays: Medicare Population County: Salt Lake
Preventable Hospital Stays: Medicare Population County: Salt Lake
1,664.0
Discharges per 100,000 Medicare enrollees
(2022)
Compared to:
UT Counties
The distribution is based on data from 29 Utah counties.
U.S. Counties
The distribution is based on data from 3,129 U.S. counties and county equivalents.
UT Value
(1,545.0)
The regional value is compared to the Utah State value.
US Value
(2,677.0)
The regional value is compared to the national value.
Prior Value
(1,612.0)
Prior Value compares a measured value with the previously measured value. Confidence intervals were not taken into account in determining the direction of the comparison.
Trend
This comparison measures the indicator’s values over multiple time periods.<br>The Mann-Kendall Test for Statistical Significance is used to evaluate the trend<br>over 4 to 10 periods of measure, subject to data availability and comparability.
Health / Health Information Technology
Persons with an Internet Subscription County: Salt Lake
Persons with an Internet Subscription County: Salt Lake
94.7%
(2018-2022)
Compared to:
UT Counties
The distribution is based on data from 29 Utah counties.
U.S. Counties
The distribution is based on data from 3,133 U.S. counties and county equivalents.
UT Value
(94.2%)
The regional value is compared to the Utah State value.
US Value
(91.0%)
The regional value is compared to the national value.
Trend
This comparison measures the indicator’s values over multiple time periods.<br>The Mann-Kendall Test for Statistical Significance is used to evaluate the trend<br>over 4 to 10 periods of measure, subject to data availability and comparability.
Health / Heart Disease & Stroke
Health / Heart Disease & Stroke
Adults who Experienced a Heart Attack, Coronary Heart Disease, or a Stroke
Value
Compared to:
Adults who Experienced a Heart Attack, Coronary Heart Disease, or a Stroke County: Salt Lake
Adults who Experienced a Heart Attack, Coronary Heart Disease, or a Stroke County: Salt Lake
6.5%
(2020-2022)
Compared to:
UT Counties
The distribution is based on data from 25 Utah counties.
UT Value
(6.4%)
The regional value is compared to the Utah State value.
Prior Value
(5.9%)
Prior Value compares a measured value with the previously measured value. Confidence intervals were taken into account in determining the direction of the comparison.
Trend
This comparison measures the indicator’s values over multiple time periods.<br>The Mann-Kendall Test for Statistical Significance is used to evaluate the trend<br>over 4 to 10 periods of measure, subject to data availability and comparability.
Health / Heart Disease & Stroke
Age-Adjusted Death Rate due to Cerebrovascular Disease (Stroke)
Value
Compared to:
Age-Adjusted Death Rate due to Cerebrovascular Disease (Stroke) County: Salt Lake
Age-Adjusted Death Rate due to Cerebrovascular Disease (Stroke) County: Salt Lake
34.0
Deaths per 100,000 population
(2019-2021)
Compared to:
UT Counties
(2017-2019)
The distribution is based on data from 20 Utah counties.
UT Value
(32.9)
The regional value is compared to the Utah State value.
US Value
(38.8 in 2020)
The regional value is compared to the national value. The source for the national value is Centers for Disease Control and Prevention
Prior Value
(36.1)
Prior Value compares a measured value with the previously measured value. Confidence intervals were taken into account in determining the direction of the comparison.
Trend
This comparison measures the indicator’s values over multiple time periods.<br>The Mann-Kendall Test for Statistical Significance is used to evaluate the trend<br>over 4 to 10 periods of measure, subject to data availability and comparability.
HP 2030 Target
(33.4)
Age-Adjusted Death Rate due to Heart Disease County: Salt Lake
Age-Adjusted Death Rate due to Heart Disease County: Salt Lake
155.6
Deaths per 100,000 population
(2019-2021)
Compared to:
UT Counties
(2018-2020)
The distribution is based on data from 27 Utah counties.
UT Value
(150.6)
The regional value is compared to the Utah State value.
US Value
(92.9 in 2017)
The regional value is compared to the national value. The source for the national value is Centers for Disease Control and Prevention
Prior Value
(152.1)
Prior Value compares a measured value with the previously measured value. Confidence intervals were taken into account in determining the direction of the comparison.
Trend
This comparison measures the indicator’s values over multiple time periods.<br>The Mann-Kendall Test for Statistical Significance is used to evaluate the trend<br>over 4 to 10 periods of measure, subject to data availability and comparability.
Age-Adjusted ER Rate due to Heart Failure County: Salt Lake
Age-Adjusted ER Rate due to Heart Failure County: Salt Lake
6.1
ER visits per 10,000 population 18+ years
(2020-2022)
Compared to:
UT Counties
The distribution is based on data from 21 Utah counties.
UT Value
(6.7)
The regional value is compared to the Utah State value.
Prior Value
(5.3)
Prior Value compares a measured value with the previously measured value. Confidence intervals were taken into account in determining the direction of the comparison.
Trend
This comparison measures the indicator’s values over multiple time periods.<br>The Mann-Kendall Test for Statistical Significance is used to evaluate the trend<br>over 4 to 10 periods of measure, subject to data availability and comparability.
Age-Adjusted ER Rate due to Hypertension County: Salt Lake
Age-Adjusted ER Rate due to Hypertension County: Salt Lake
18.4
ER visits per 10,000 population 18+ years
(2020-2022)
Compared to:
UT Counties
The distribution is based on data from 25 Utah counties.
UT Value
(20.6)
The regional value is compared to the Utah State value.
Prior Value
(16.6)
Prior Value compares a measured value with the previously measured value. Confidence intervals were taken into account in determining the direction of the comparison.
Trend
This comparison measures the indicator’s values over multiple time periods.<br>The Mann-Kendall Test for Statistical Significance is used to evaluate the trend<br>over 4 to 10 periods of measure, subject to data availability and comparability.
Health / Heart Disease & Stroke
Age-Adjusted Hospitalization Rate due to Heart Attack
Value
Compared to:
Age-Adjusted Hospitalization Rate due to Heart Attack County: Salt Lake
Age-Adjusted Hospitalization Rate due to Heart Attack County: Salt Lake
19.9
Hospitalizations per 10,000 population 35+ years
(2022)
Compared to:
UT Counties
The distribution is based on data from 29 Utah counties.
UT Value
(20.6)
The regional value is compared to the Utah State value.
Prior Value
(17.1)
Prior Value compares a measured value with the previously measured value. Confidence intervals were not taken into account in determining the direction of the comparison.
Trend
This comparison measures the indicator’s values over multiple time periods.<br>The Mann-Kendall Test for Statistical Significance is used to evaluate the trend<br>over 4 to 10 periods of measure, subject to data availability and comparability.
Health / Heart Disease & Stroke
Age-Adjusted Hospitalization Rate due to Heart Failure
Value
Compared to:
Age-Adjusted Hospitalization Rate due to Heart Failure County: Salt Lake
Age-Adjusted Hospitalization Rate due to Heart Failure County: Salt Lake
21.1
Hospitalizations per 10,000 population 18+ years
(2020-2022)
Compared to:
UT Counties
The distribution is based on data from 24 Utah counties.
UT Value
(18.3)
The regional value is compared to the Utah State value.
Prior Value
(21.5)
Prior Value compares a measured value with the previously measured value. Confidence intervals were taken into account in determining the direction of the comparison.
Trend
This comparison measures the indicator’s values over multiple time periods.<br>The Mann-Kendall Test for Statistical Significance is used to evaluate the trend<br>over 4 to 10 periods of measure, subject to data availability and comparability.
Health / Heart Disease & Stroke
Age-Adjusted Hospitalization Rate due to Hypertension
Value
Compared to:
Age-Adjusted Hospitalization Rate due to Hypertension County: Salt Lake
Age-Adjusted Hospitalization Rate due to Hypertension County: Salt Lake
2.2
Hospitalizations per 10,000 population 18+ years
(2020-2022)
Compared to:
UT Value
(2.0)
The regional value is compared to the Utah State value.
Prior Value
(2.2)
Prior Value compares a measured value with the previously measured value. Confidence intervals were taken into account in determining the direction of the comparison.
Trend
This comparison measures the indicator’s values over multiple time periods.<br>The Mann-Kendall Test for Statistical Significance is used to evaluate the trend<br>over 4 to 10 periods of measure, subject to data availability and comparability.
Atrial Fibrillation: Medicare Population County: Salt Lake
Atrial Fibrillation: Medicare Population County: Salt Lake
13.0%
(2022)
Compared to:
UT Counties
The distribution is based on data from 29 Utah counties.
U.S. Counties
The distribution is based on data from 3,129 U.S. counties and county equivalents.
UT Value
(13.0%)
The regional value is compared to the Utah State value.
US Value
(14.0%)
The regional value is compared to the national value.
Prior Value
(13.0%)
Prior Value compares a measured value with the previously measured value. Confidence intervals were not taken into account in determining the direction of the comparison.
Trend
This comparison measures the indicator’s values over multiple time periods.<br>The Mann-Kendall Test for Statistical Significance is used to evaluate the trend<br>over 4 to 10 periods of measure, subject to data availability and comparability.
Heart Failure: Medicare Population County: Salt Lake
Heart Failure: Medicare Population County: Salt Lake
11.0%
(2022)
Compared to:
UT Counties
The distribution is based on data from 29 Utah counties.
U.S. Counties
The distribution is based on data from 3,129 U.S. counties and county equivalents.
UT Value
(11.0%)
The regional value is compared to the Utah State value.
US Value
(11.0%)
The regional value is compared to the national value.
Prior Value
(10.0%)
Prior Value compares a measured value with the previously measured value. Confidence intervals were not taken into account in determining the direction of the comparison.
Trend
This comparison measures the indicator’s values over multiple time periods.<br>The Mann-Kendall Test for Statistical Significance is used to evaluate the trend<br>over 4 to 10 periods of measure, subject to data availability and comparability.
High Blood Pressure Prevalence County: Salt Lake
High Blood Pressure Prevalence County: Salt Lake
27.6%
(2019-2021)
Compared to:
UT Counties
The distribution is based on data from 26 Utah counties.
UT Value
(27.3%)
The regional value is compared to the Utah State value.
US Value
(32.4% in 2021)
The regional value is compared to the national value. The source for the national value is Behavioral Risk Factor Surveillance System
Prior Value
(26.8%)
Prior Value compares a measured value with the previously measured value. Confidence intervals were taken into account in determining the direction of the comparison.
Trend
This comparison measures the indicator’s values over multiple time periods.<br>The Mann-Kendall Test for Statistical Significance is used to evaluate the trend<br>over 4 to 10 periods of measure, subject to data availability and comparability.
HP 2030 Target
(41.9%)
High Cholesterol Prevalence County: Salt Lake
High Cholesterol Prevalence County: Salt Lake
25.0%
(2019-2021)
Compared to:
UT Counties
The distribution is based on data from 24 Utah counties.
UT Value
(24.9%)
The regional value is compared to the Utah State value.
Prior Value
(24.4%)
Prior Value compares a measured value with the previously measured value. Confidence intervals were taken into account in determining the direction of the comparison.
Trend
This comparison measures the indicator’s values over multiple time periods.<br>The Mann-Kendall Test for Statistical Significance is used to evaluate the trend<br>over 4 to 10 periods of measure, subject to data availability and comparability.
Hyperlipidemia: Medicare Population County: Salt Lake
Hyperlipidemia: Medicare Population County: Salt Lake
54.0%
(2022)
Compared to:
UT Counties
The distribution is based on data from 29 Utah counties.
U.S. Counties
The distribution is based on data from 3,129 U.S. counties and county equivalents.
UT Value
(53.0%)
The regional value is compared to the Utah State value.
US Value
(65.0%)
The regional value is compared to the national value.
Prior Value
(53.0%)
Prior Value compares a measured value with the previously measured value. Confidence intervals were not taken into account in determining the direction of the comparison.
Trend
This comparison measures the indicator’s values over multiple time periods.<br>The Mann-Kendall Test for Statistical Significance is used to evaluate the trend<br>over 4 to 10 periods of measure, subject to data availability and comparability.
Hypertension: Medicare Population County: Salt Lake
Hypertension: Medicare Population County: Salt Lake
58.0%
(2022)
Compared to:
UT Counties
The distribution is based on data from 29 Utah counties.
U.S. Counties
The distribution is based on data from 3,129 U.S. counties and county equivalents.
UT Value
(58.0%)
The regional value is compared to the Utah State value.
US Value
(65.0%)
The regional value is compared to the national value.
Prior Value
(57.0%)
Prior Value compares a measured value with the previously measured value. Confidence intervals were not taken into account in determining the direction of the comparison.
Trend
This comparison measures the indicator’s values over multiple time periods.<br>The Mann-Kendall Test for Statistical Significance is used to evaluate the trend<br>over 4 to 10 periods of measure, subject to data availability and comparability.
Ischemic Heart Disease: Medicare Population County: Salt Lake
Ischemic Heart Disease: Medicare Population County: Salt Lake
17.0%
(2022)
Compared to:
UT Counties
The distribution is based on data from 29 Utah counties.
U.S. Counties
The distribution is based on data from 3,129 U.S. counties and county equivalents.
UT Value
(17.0%)
The regional value is compared to the Utah State value.
US Value
(21.0%)
The regional value is compared to the national value.
Prior Value
(17.0%)
Prior Value compares a measured value with the previously measured value. Confidence intervals were not taken into account in determining the direction of the comparison.
Trend
This comparison measures the indicator’s values over multiple time periods.<br>The Mann-Kendall Test for Statistical Significance is used to evaluate the trend<br>over 4 to 10 periods of measure, subject to data availability and comparability.
Stroke: Medicare Population County: Salt Lake
Stroke: Medicare Population County: Salt Lake
5.0%
(2022)
Compared to:
UT Counties
The distribution is based on data from 29 Utah counties.
U.S. Counties
The distribution is based on data from 3,129 U.S. counties and county equivalents.
UT Value
(4.0%)
The regional value is compared to the Utah State value.
US Value
(6.0%)
The regional value is compared to the national value.
Prior Value
(5.0%)
Prior Value compares a measured value with the previously measured value. Confidence intervals were not taken into account in determining the direction of the comparison.
Trend
This comparison measures the indicator’s values over multiple time periods.<br>The Mann-Kendall Test for Statistical Significance is used to evaluate the trend<br>over 4 to 10 periods of measure, subject to data availability and comparability.
Health / Immunizations & Infectious Diseases
Health / Immunizations & Infectious Diseases
Adults 65+ with Pneumonia Vaccination
Value
Compared to:
Adults 65+ with Pneumonia Vaccination County: Salt Lake
Adults 65+ with Pneumonia Vaccination County: Salt Lake
78.0%
(2019-2021)
Compared to:
UT Counties
The distribution is based on data from 24 Utah counties.
UT Value
(74.6%)
The regional value is compared to the Utah State value.
Prior Value
(78.1%)
Prior Value compares a measured value with the previously measured value. Confidence intervals were taken into account in determining the direction of the comparison.
Trend
This comparison measures the indicator’s values over multiple time periods.<br>The Mann-Kendall Test for Statistical Significance is used to evaluate the trend<br>over 4 to 10 periods of measure, subject to data availability and comparability.
Adults with Influenza Vaccination County: Salt Lake
Adults with Influenza Vaccination County: Salt Lake
49.5%
(2022)
Compared to:
UT Counties
The distribution is based on data from 26 Utah counties.
UT Value
(43.5%)
The regional value is compared to the Utah State value.
Prior Value
(44.6%)
Prior Value compares a measured value with the previously measured value. Confidence intervals were taken into account in determining the direction of the comparison.
Trend
This comparison measures the indicator’s values over multiple time periods.<br>The Mann-Kendall Test for Statistical Significance is used to evaluate the trend<br>over 4 to 10 periods of measure, subject to data availability and comparability.
Health / Immunizations & Infectious Diseases
Age-Adjusted Death Rate due to Influenza and Pneumonia
Value
Compared to:
Age-Adjusted Death Rate due to Influenza and Pneumonia County: Salt Lake
Age-Adjusted Death Rate due to Influenza and Pneumonia County: Salt Lake
7.6
Deaths per 100,000 population
(2019-2021)
Compared to:
UT Value
(9.6)
The regional value is compared to the Utah State value.
US Value
(13.0 in 2020)
The regional value is compared to the national value. The source for the national value is Centers for Disease Control and Prevention
Prior Value
(9.7)
Prior Value compares a measured value with the previously measured value. Confidence intervals were taken into account in determining the direction of the comparison.
Trend
This comparison measures the indicator’s values over multiple time periods.<br>The Mann-Kendall Test for Statistical Significance is used to evaluate the trend<br>over 4 to 10 periods of measure, subject to data availability and comparability.
Health / Immunizations & Infectious Diseases
Age-Adjusted ER Rate due to Community Acquired Pneumonia
Value
Compared to:
Age-Adjusted ER Rate due to Community Acquired Pneumonia County: Salt Lake
Age-Adjusted ER Rate due to Community Acquired Pneumonia County: Salt Lake
15.4
ER visits per 10,000 population 18+ years
(2020-2022)
Compared to:
UT Counties
The distribution is based on data from 26 Utah counties.
UT Value
(17.4)
The regional value is compared to the Utah State value.
Prior Value
(15.6)
Prior Value compares a measured value with the previously measured value. Confidence intervals were taken into account in determining the direction of the comparison.
Trend
This comparison measures the indicator’s values over multiple time periods.<br>The Mann-Kendall Test for Statistical Significance is used to evaluate the trend<br>over 4 to 10 periods of measure, subject to data availability and comparability.
Health / Immunizations & Infectious Diseases
Age-Adjusted ER Rate due to Hepatitis
Value
Compared to:
Age-Adjusted ER Rate due to Hepatitis County: Salt Lake
Age-Adjusted ER Rate due to Hepatitis County: Salt Lake
0.8
ER visits per 10,000 population 18+ years
(2020-2022)
Compared to:
UT Value
(0.8)
The regional value is compared to the Utah State value.
Prior Value
(0.8)
Prior Value compares a measured value with the previously measured value. Confidence intervals were taken into account in determining the direction of the comparison.
Trend
This comparison measures the indicator’s values over multiple time periods.<br>The Mann-Kendall Test for Statistical Significance is used to evaluate the trend<br>over 4 to 10 periods of measure, subject to data availability and comparability.
Health / Immunizations & Infectious Diseases
Age-Adjusted ER Rate due to Immunization-Preventable Pneumonia and Influenza
Value
Compared to:
Age-Adjusted ER Rate due to Immunization-Preventable Pneumonia and Influenza County: Salt Lake
Age-Adjusted ER Rate due to Immunization-Preventable Pneumonia and Influenza County: Salt Lake
13.9
ER visits per 10,000 population 18+ years
(2020-2022)
Compared to:
UT Counties
The distribution is based on data from 24 Utah counties.
UT Value
(13.6)
The regional value is compared to the Utah State value.
Prior Value
(11.1)
Prior Value compares a measured value with the previously measured value. Confidence intervals were taken into account in determining the direction of the comparison.
Trend
This comparison measures the indicator’s values over multiple time periods.<br>The Mann-Kendall Test for Statistical Significance is used to evaluate the trend<br>over 4 to 10 periods of measure, subject to data availability and comparability.
Health / Immunizations & Infectious Diseases
Age-Adjusted Hospitalization Rate due to Community Acquired Pneumonia
Value
Compared to:
Age-Adjusted Hospitalization Rate due to Community Acquired Pneumonia County: Salt Lake
Age-Adjusted Hospitalization Rate due to Community Acquired Pneumonia County: Salt Lake
7.3
Hospitalizations per 10,000 population 18+ years
(2020-2022)
Compared to:
UT Counties
The distribution is based on data from 23 Utah counties.
UT Value
(8.1)
The regional value is compared to the Utah State value.
Prior Value
(8.1)
Prior Value compares a measured value with the previously measured value. Confidence intervals were taken into account in determining the direction of the comparison.
Trend
This comparison measures the indicator’s values over multiple time periods.<br>The Mann-Kendall Test for Statistical Significance is used to evaluate the trend<br>over 4 to 10 periods of measure, subject to data availability and comparability.
Health / Immunizations & Infectious Diseases
Age-Adjusted Hospitalization Rate due to Hepatitis
Value
Compared to:
Age-Adjusted Hospitalization Rate due to Hepatitis County: Salt Lake
Age-Adjusted Hospitalization Rate due to Hepatitis County: Salt Lake
1.4
Hospitalizations per 10,000 population 18+ years
(2020-2022)
Compared to:
UT Value
(1.2)
The regional value is compared to the Utah State value.
Prior Value
(1.3)
Prior Value compares a measured value with the previously measured value. Confidence intervals were taken into account in determining the direction of the comparison.
Trend
This comparison measures the indicator’s values over multiple time periods.<br>The Mann-Kendall Test for Statistical Significance is used to evaluate the trend<br>over 4 to 10 periods of measure, subject to data availability and comparability.
Health / Immunizations & Infectious Diseases
Age-Adjusted Hospitalization Rate due to Immunization-Preventable Pneumonia and Influenza
Value
Compared to:
Age-Adjusted Hospitalization Rate due to Immunization-Preventable Pneumonia and Influenza County: Salt Lake
Age-Adjusted Hospitalization Rate due to Immunization-Preventable Pneumonia and Influenza County: Salt Lake
1.7
Hospitalizations per 10,000 population 18+ years
(2020-2022)
Compared to:
UT Counties
(2019-2021)
The distribution is based on data from 20 Utah counties.
UT Value
(1.6)
The regional value is compared to the Utah State value.
Prior Value
(2.3)
Prior Value compares a measured value with the previously measured value. Confidence intervals were taken into account in determining the direction of the comparison.
Trend
This comparison measures the indicator’s values over multiple time periods.<br>The Mann-Kendall Test for Statistical Significance is used to evaluate the trend<br>over 4 to 10 periods of measure, subject to data availability and comparability.
Health / Immunizations & Infectious Diseases
Flu Vaccinations: Medicare Population
Value
Compared to:
Flu Vaccinations: Medicare Population County: Salt Lake
Flu Vaccinations: Medicare Population County: Salt Lake
54.0%
(2022)
Compared to:

UT Counties
The distribution is based on data from 29 Utah counties.
U.S. Counties
The distribution is based on data from 3,129 U.S. counties and county equivalents.
UT Value
(49.0%)
The regional value is compared to the Utah State value.
US Value
(50.0%)
The regional value is compared to the national value.
Prior Value
(55.0%)
Prior Value compares a measured value with the previously measured value. Confidence intervals were not taken into account in determining the direction of the comparison.
Trend
This comparison measures the indicator’s values over multiple time periods.<br>The Mann-Kendall Test for Statistical Significance is used to evaluate the trend<br>over 4 to 10 periods of measure, subject to data availability and comparability.
Health / Immunizations & Infectious Diseases
Persons Fully Vaccinated Against COVID-19
Value
Compared to:
Persons Fully Vaccinated Against COVID-19 County: Salt Lake
Persons Fully Vaccinated Against COVID-19 County: Salt Lake
73.1%
(May 10, 2023)
Compared to:
UT Counties
The distribution is based on data from 29 Utah counties.
U.S. Counties
The distribution is based on data from 3,125 U.S. counties and county equivalents.
Prior Value
(73.1%)
Prior Value compares a measured value with the previously measured value. Confidence intervals were not taken into account in determining the direction of the comparison.
Trend
This comparison measures the indicator’s values over multiple time periods.<br>The Mann-Kendall Test for Statistical Significance is used to evaluate the trend<br>over 4 to 10 periods of measure, subject to data availability and comparability.
Health / Immunizations & Infectious Diseases
Pneumonia Vaccinations: Medicare Population
Value
Compared to:
Pneumonia Vaccinations: Medicare Population County: Salt Lake
Pneumonia Vaccinations: Medicare Population County: Salt Lake
8.0%
(2022)
Compared to:

UT Counties
The distribution is based on data from 29 Utah counties.
U.S. Counties
The distribution is based on data from 3,129 U.S. counties and county equivalents.
UT Value
(7.0%)
The regional value is compared to the Utah State value.
US Value
(8.0%)
The regional value is compared to the national value.
Prior Value
(7.0%)
Prior Value compares a measured value with the previously measured value. Confidence intervals were not taken into account in determining the direction of the comparison.
Trend
This comparison measures the indicator’s values over multiple time periods.<br>The Mann-Kendall Test for Statistical Significance is used to evaluate the trend<br>over 4 to 10 periods of measure, subject to data availability and comparability.
Health / Maternal, Fetal & Infant Health
Babies with Low Birthweight County: Salt Lake
Babies with Low Birthweight County: Salt Lake
7.7%
(2021)
Compared to:
UT Value
(7.4%)
The regional value is compared to the Utah State value.
US Value
(8.5%)
The regional value is compared to the national value. The source for the national value is Centers for Disease Control and Prevention
Prior Value
(7.6%)
Prior Value compares a measured value with the previously measured value. Confidence intervals were taken into account in determining the direction of the comparison.
Trend
This comparison measures the indicator’s values over multiple time periods.<br>The Mann-Kendall Test for Statistical Significance is used to evaluate the trend<br>over 4 to 10 periods of measure, subject to data availability and comparability.
Infant Mortality Rate County: Salt Lake
Infant Mortality Rate County: Salt Lake
5.9
Deaths per 1,000 live births
(2017-2021)
Compared to:
UT Value
(5.4)
The regional value is compared to the Utah State value.
US Value
(5.8 in 2014-2018)
The regional value is compared to the national value. The source for the national value is Centers for Disease Control and Prevention
Prior Value
(6.0)
Prior Value compares a measured value with the previously measured value. Confidence intervals were taken into account in determining the direction of the comparison.
Trend
This comparison measures the indicator’s values over multiple time periods.<br>The Mann-Kendall Test for Statistical Significance is used to evaluate the trend<br>over 4 to 10 periods of measure, subject to data availability and comparability.
HP 2030 Target
(5.0)
<div>MICH-02: Reduce the rate of infant deaths <strong>(LEADING HEALTH INDICATOR)</strong></div>
Health / Maternal, Fetal & Infant Health
Mothers who Received Early Prenatal Care
Value
Compared to:
Mothers who Received Early Prenatal Care County: Salt Lake
Mothers who Received Early Prenatal Care County: Salt Lake
70.1%
(2022)
Compared to:
UT Counties
The distribution is based on data from 27 Utah counties.
UT Value
(79.6% in 2021)
The regional value is compared to the Utah State value.
US Value
(78.3% in 2021)
The regional value is compared to the national value. The source for the national value is Centers for Disease Control and Prevention
Prior Value
(74.6%)
Prior Value compares a measured value with the previously measured value. Confidence intervals were taken into account in determining the direction of the comparison.
Trend
This comparison measures the indicator’s values over multiple time periods.<br>The Mann-Kendall Test for Statistical Significance is used to evaluate the trend<br>over 4 to 10 periods of measure, subject to data availability and comparability.
Preterm Births County: Salt Lake
Preterm Births County: Salt Lake
9.8%
(2021)
Compared to:
UT Counties
The distribution is based on data from 27 Utah counties.
UT Value
(9.9%)
The regional value is compared to the Utah State value.
US Value
(10.5%)
The regional value is compared to the national value. The source for the national value is Centers for Disease Control and Prevention
Prior Value
(9.6%)
Prior Value compares a measured value with the previously measured value. Confidence intervals were taken into account in determining the direction of the comparison.
Trend
This comparison measures the indicator’s values over multiple time periods.<br>The Mann-Kendall Test for Statistical Significance is used to evaluate the trend<br>over 4 to 10 periods of measure, subject to data availability and comparability.
HP 2030 Target
(9.4%)
Health / Mental Health & Mental Disorders
Adult Days in Poor Mental Health County: Salt Lake
Adult Days in Poor Mental Health County: Salt Lake
25.1%
(2020-2022)
Compared to:
UT Counties
The distribution is based on data from 25 Utah counties.
UT Value
(23.8%)
The regional value is compared to the Utah State value.
Prior Value
(24.1%)
Prior Value compares a measured value with the previously measured value. Confidence intervals were taken into account in determining the direction of the comparison.
Trend
This comparison measures the indicator’s values over multiple time periods.<br>The Mann-Kendall Test for Statistical Significance is used to evaluate the trend<br>over 4 to 10 periods of measure, subject to data availability and comparability.
Adults Ever Diagnosed with Depression County: Salt Lake
Adults Ever Diagnosed with Depression County: Salt Lake
25.0%
(2020-2022)
Compared to:
UT Counties
The distribution is based on data from 27 Utah counties.
UT Value
(24.5%)
The regional value is compared to the Utah State value.
Prior Value
(24.2%)
Prior Value compares a measured value with the previously measured value. Confidence intervals were taken into account in determining the direction of the comparison.
Trend
This comparison measures the indicator’s values over multiple time periods.<br>The Mann-Kendall Test for Statistical Significance is used to evaluate the trend<br>over 4 to 10 periods of measure, subject to data availability and comparability.
Age-Adjusted Death Rate due to Suicide County: Salt Lake
Age-Adjusted Death Rate due to Suicide County: Salt Lake
20.7
Deaths per 100,000 population
(2019-2021)
Compared to:
UT Value
(20.6)
The regional value is compared to the Utah State value.
US Value
(13.5 in 2020)
The regional value is compared to the national value. The source for the national value is Centers for Disease Control and Prevention
Prior Value
(21.3)
Prior Value compares a measured value with the previously measured value. Confidence intervals were taken into account in determining the direction of the comparison.
Trend
This comparison measures the indicator’s values over multiple time periods.<br>The Mann-Kendall Test for Statistical Significance is used to evaluate the trend<br>over 4 to 10 periods of measure, subject to data availability and comparability.
HP 2030 Target
(12.8)
<div>MHMD-01: Reduce the suicide rate <strong>(LEADING HEALTH INDICATOR)</strong></div>
Health / Mental Health & Mental Disorders
Age-Adjusted ER Rate due to Adolescent Suicide and Intentional Self-inflicted Injury
Value
Compared to:
Age-Adjusted ER Rate due to Adolescent Suicide and Intentional Self-inflicted Injury County: Salt Lake
Age-Adjusted ER Rate due to Adolescent Suicide and Intentional Self-inflicted Injury County: Salt Lake
97.2
ER visits per 10,000 population aged 10-17
(2020-2022)
Compared to:
UT Counties
The distribution is based on data from 27 Utah counties.
UT Value
(95.8)
The regional value is compared to the Utah State value.
Prior Value
(98.1)
Prior Value compares a measured value with the previously measured value. Confidence intervals were taken into account in determining the direction of the comparison.
Trend
This comparison measures the indicator’s values over multiple time periods.<br>The Mann-Kendall Test for Statistical Significance is used to evaluate the trend<br>over 4 to 10 periods of measure, subject to data availability and comparability.
Health / Mental Health & Mental Disorders
Age-Adjusted ER Rate due to Adult Mental Health
Value
Compared to:
Age-Adjusted ER Rate due to Adult Mental Health County: Salt Lake
Age-Adjusted ER Rate due to Adult Mental Health County: Salt Lake
68.3
ER visits per 10,000 population 18+ years
(2020-2022)
Compared to:
UT Counties
The distribution is based on data from 27 Utah counties.
UT Value
(56.6)
The regional value is compared to the Utah State value.
Prior Value
(76.6)
Prior Value compares a measured value with the previously measured value. Confidence intervals were taken into account in determining the direction of the comparison.
Trend
This comparison measures the indicator’s values over multiple time periods.<br>The Mann-Kendall Test for Statistical Significance is used to evaluate the trend<br>over 4 to 10 periods of measure, subject to data availability and comparability.
Health / Mental Health & Mental Disorders
Age-Adjusted ER Rate due to Adult Suicide and Intentional Self-inflicted Injury
Value
Compared to:
Age-Adjusted ER Rate due to Adult Suicide and Intentional Self-inflicted Injury County: Salt Lake
Age-Adjusted ER Rate due to Adult Suicide and Intentional Self-inflicted Injury County: Salt Lake
48.0
ER visits per 10,000 population 18+ years
(2020-2022)
Compared to:
UT Counties
The distribution is based on data from 26 Utah counties.
UT Value
(37.3)
The regional value is compared to the Utah State value.
Prior Value
(49.3)
Prior Value compares a measured value with the previously measured value. Confidence intervals were taken into account in determining the direction of the comparison.
Trend
This comparison measures the indicator’s values over multiple time periods.<br>The Mann-Kendall Test for Statistical Significance is used to evaluate the trend<br>over 4 to 10 periods of measure, subject to data availability and comparability.
Health / Mental Health & Mental Disorders
Age-Adjusted ER Rate due to Pediatric Mental Health
Value
Compared to:
Age-Adjusted ER Rate due to Pediatric Mental Health County: Salt Lake
Age-Adjusted ER Rate due to Pediatric Mental Health County: Salt Lake
35.5
ER visits per 10,000 population under 18 years
(2020-2022)
Compared to:
UT Counties
The distribution is based on data from 25 Utah counties.
UT Value
(32.4)
The regional value is compared to the Utah State value.
Prior Value
(44.3)
Prior Value compares a measured value with the previously measured value. Confidence intervals were taken into account in determining the direction of the comparison.
Trend
This comparison measures the indicator’s values over multiple time periods.<br>The Mann-Kendall Test for Statistical Significance is used to evaluate the trend<br>over 4 to 10 periods of measure, subject to data availability and comparability.
Health / Mental Health & Mental Disorders
Age-Adjusted Hospitalization Rate due to Adolescent Suicide and Intentional Self-inflicted Injury
Value
Compared to:
Age-Adjusted Hospitalization Rate due to Adolescent Suicide and Intentional Self-inflicted Injury County: Salt Lake
Age-Adjusted Hospitalization Rate due to Adolescent Suicide and Intentional Self-inflicted Injury County: Salt Lake
55.0
Hospitalizations per 10,000 population aged 10-17
(2020-2022)
Compared to:
UT Counties
The distribution is based on data from 22 Utah counties.
UT Value
(49.2)
The regional value is compared to the Utah State value.
Prior Value
(54.9)
Prior Value compares a measured value with the previously measured value. Confidence intervals were taken into account in determining the direction of the comparison.
Trend
This comparison measures the indicator’s values over multiple time periods.<br>The Mann-Kendall Test for Statistical Significance is used to evaluate the trend<br>over 4 to 10 periods of measure, subject to data availability and comparability.
Health / Mental Health & Mental Disorders
Age-Adjusted Hospitalization Rate due to Adult Mental Health
Value
Compared to:
Age-Adjusted Hospitalization Rate due to Adult Mental Health County: Salt Lake
Age-Adjusted Hospitalization Rate due to Adult Mental Health County: Salt Lake
36.9
Hospitalizations per 10,000 population 18+ years
(2020-2022)
Compared to:
UT Counties
The distribution is based on data from 25 Utah counties.
UT Value
(37.0)
The regional value is compared to the Utah State value.
Prior Value
(38.8)
Prior Value compares a measured value with the previously measured value. Confidence intervals were taken into account in determining the direction of the comparison.
Trend
This comparison measures the indicator’s values over multiple time periods.<br>The Mann-Kendall Test for Statistical Significance is used to evaluate the trend<br>over 4 to 10 periods of measure, subject to data availability and comparability.
Health / Mental Health & Mental Disorders
Age-Adjusted Hospitalization Rate due to Adult Suicide and Intentional Self-inflicted Injury
Value
Compared to:
Age-Adjusted Hospitalization Rate due to Adult Suicide and Intentional Self-inflicted Injury County: Salt Lake
Age-Adjusted Hospitalization Rate due to Adult Suicide and Intentional Self-inflicted Injury County: Salt Lake
42.7
Hospitalizations per 10,000 population 18+ years
(2020-2022)
Compared to:
UT Counties
The distribution is based on data from 26 Utah counties.
UT Value
(40.4)
The regional value is compared to the Utah State value.
Prior Value
(46.7)
Prior Value compares a measured value with the previously measured value. Confidence intervals were taken into account in determining the direction of the comparison.
Trend
This comparison measures the indicator’s values over multiple time periods.<br>The Mann-Kendall Test for Statistical Significance is used to evaluate the trend<br>over 4 to 10 periods of measure, subject to data availability and comparability.
Health / Mental Health & Mental Disorders
Age-Adjusted Hospitalization Rate due to Pediatric Mental Health
Value
Compared to:
Age-Adjusted Hospitalization Rate due to Pediatric Mental Health County: Salt Lake
Age-Adjusted Hospitalization Rate due to Pediatric Mental Health County: Salt Lake
22.1
Hospitalizations per 10,000 population under 18 years
(2020-2022)
Compared to:
UT Counties
The distribution is based on data from 23 Utah counties.
UT Value
(20.9)
The regional value is compared to the Utah State value.
Prior Value
(23.0)
Prior Value compares a measured value with the previously measured value. Confidence intervals were taken into account in determining the direction of the comparison.
Trend
This comparison measures the indicator’s values over multiple time periods.<br>The Mann-Kendall Test for Statistical Significance is used to evaluate the trend<br>over 4 to 10 periods of measure, subject to data availability and comparability.
Depression: Medicare Population County: Salt Lake
Depression: Medicare Population County: Salt Lake
23.0%
(2022)
Compared to:
UT Counties
The distribution is based on data from 29 Utah counties.
U.S. Counties
The distribution is based on data from 3,129 U.S. counties and county equivalents.
UT Value
(21.0%)
The regional value is compared to the Utah State value.
US Value
(16.0%)
The regional value is compared to the national value.
Prior Value
(23.0%)
Prior Value compares a measured value with the previously measured value. Confidence intervals were not taken into account in determining the direction of the comparison.
Trend
This comparison measures the indicator’s values over multiple time periods.<br>The Mann-Kendall Test for Statistical Significance is used to evaluate the trend<br>over 4 to 10 periods of measure, subject to data availability and comparability.
Health / Mortality Data
Life Expectancy County: Salt Lake
Life Expectancy County: Salt Lake
78.8
Years
(2019-2021)
Compared to:
UT Counties
The distribution is based on data from 27 Utah counties.
U.S. Counties
The distribution is based on data from 3,070 U.S. counties and county equivalents.
UT Value
(79.1)
The regional value is compared to the Utah State value.
US Value
(77.6)
The regional value is compared to the national value.
Health / Older Adults
Adults 65+ with a Disability County: Salt Lake
Adults 65+ with a Disability County: Salt Lake
30.0%
(2018-2022)
Compared to:
UT Value
(30.9%)
The regional value is compared to the Utah State value.
US Value
(33.3%)
The regional value is compared to the national value.
Trend
This comparison measures the indicator’s values over multiple time periods.<br>The Mann-Kendall Test for Statistical Significance is used to evaluate the trend<br>over 4 to 10 periods of measure, subject to data availability and comparability.
Adults 65+ with a Hearing Difficulty County: Salt Lake
Adults 65+ with a Hearing Difficulty County: Salt Lake
13.5%
(2018-2022)
Compared to:
UT Value
(15.2%)
The regional value is compared to the Utah State value.
US Value
(13.7%)
The regional value is compared to the national value.
Trend
This comparison measures the indicator’s values over multiple time periods.<br>The Mann-Kendall Test for Statistical Significance is used to evaluate the trend<br>over 4 to 10 periods of measure, subject to data availability and comparability.
Adults 65+ with a Self-Care Difficulty County: Salt Lake
Adults 65+ with a Self-Care Difficulty County: Salt Lake
5.9%
(2018-2022)
Compared to:
UT Value
(5.5%)
The regional value is compared to the Utah State value.
US Value
(7.4%)
The regional value is compared to the national value.
Trend
This comparison measures the indicator’s values over multiple time periods.<br>The Mann-Kendall Test for Statistical Significance is used to evaluate the trend<br>over 4 to 10 periods of measure, subject to data availability and comparability.
Adults 65+ with a Vision Difficulty County: Salt Lake
Adults 65+ with a Vision Difficulty County: Salt Lake
5.1%
(2018-2022)
Compared to:
UT Value
(5.2%)
The regional value is compared to the Utah State value.
US Value
(6.0%)
The regional value is compared to the national value.
Trend
This comparison measures the indicator’s values over multiple time periods.<br>The Mann-Kendall Test for Statistical Significance is used to evaluate the trend<br>over 4 to 10 periods of measure, subject to data availability and comparability.
Adults 65+ with an Independent Living Difficulty County: Salt Lake
Adults 65+ with an Independent Living Difficulty County: Salt Lake
12.1%
(2018-2022)
Compared to:
UT Value
(11.1%)
The regional value is compared to the Utah State value.
US Value
(13.6%)
The regional value is compared to the national value.
Trend
This comparison measures the indicator’s values over multiple time periods.<br>The Mann-Kendall Test for Statistical Significance is used to evaluate the trend<br>over 4 to 10 periods of measure, subject to data availability and comparability.
Age-Adjusted Death Rate due to Alzheimer's Disease County: Salt Lake
Age-Adjusted Death Rate due to Alzheimer's Disease County: Salt Lake
38.5
Deaths per 100,000 population
(2019-2021)
Compared to:
UT Value
(39.5)
The regional value is compared to the Utah State value.
US Value
(32.4 in 2020)
The regional value is compared to the national value. The source for the national value is Centers for Disease Control and Prevention
Prior Value
(40.2)
Prior Value compares a measured value with the previously measured value. Confidence intervals were taken into account in determining the direction of the comparison.
Trend
This comparison measures the indicator’s values over multiple time periods.<br>The Mann-Kendall Test for Statistical Significance is used to evaluate the trend<br>over 4 to 10 periods of measure, subject to data availability and comparability.
Alzheimer's Disease or Dementia: Medicare Population County: Salt Lake
Alzheimer's Disease or Dementia: Medicare Population County: Salt Lake
6.0%
(2022)
Compared to:
UT Counties
The distribution is based on data from 29 Utah counties.
U.S. Counties
The distribution is based on data from 3,129 U.S. counties and county equivalents.
UT Value
(6.0%)
The regional value is compared to the Utah State value.
US Value
(6.0%)
The regional value is compared to the national value.
Prior Value
(6.0%)
Prior Value compares a measured value with the previously measured value. Confidence intervals were not taken into account in determining the direction of the comparison.
Trend
This comparison measures the indicator’s values over multiple time periods.<br>The Mann-Kendall Test for Statistical Significance is used to evaluate the trend<br>over 4 to 10 periods of measure, subject to data availability and comparability.
Health / Older Adults
Hospitalization Rate due to Hip Fractures Among Females 65+
Value
Compared to:
Hospitalization Rate due to Hip Fractures Among Females 65+ County: Salt Lake
Hospitalization Rate due to Hip Fractures Among Females 65+ County: Salt Lake
122.5
Hospitalizations per 100,000 females 65+ years
(2020-2022)
Compared to:
UT Value
(443.6)
The regional value is compared to the Utah State value.
Prior Value
(119.0)
Prior Value compares a measured value with the previously measured value. Confidence intervals were taken into account in determining the direction of the comparison.
Trend
This comparison measures the indicator’s values over multiple time periods.<br>The Mann-Kendall Test for Statistical Significance is used to evaluate the trend<br>over 4 to 10 periods of measure, subject to data availability and comparability.
Hospitalization Rate due to Hip Fractures Among Males 65+ County: Salt Lake
Hospitalization Rate due to Hip Fractures Among Males 65+ County: Salt Lake
61.9
Hospitalizations per 100,000 males 65+ years
(2020-2022)
Compared to:
UT Value
(268.5)
The regional value is compared to the Utah State value.
Prior Value
(56.6)
Prior Value compares a measured value with the previously measured value. Confidence intervals were taken into account in determining the direction of the comparison.
Trend
This comparison measures the indicator’s values over multiple time periods.<br>The Mann-Kendall Test for Statistical Significance is used to evaluate the trend<br>over 4 to 10 periods of measure, subject to data availability and comparability.
Health / Oral Health
Adults who Visited a Dentist County: Salt Lake
Adults who Visited a Dentist County: Salt Lake
72.2%
(2020)
Compared to:
UT Counties
The distribution is based on data from 23 Utah counties.
UT Value
(73.1%)
The regional value is compared to the Utah State value.
Prior Value
(70.2%)
Prior Value compares a measured value with the previously measured value. Confidence intervals were taken into account in determining the direction of the comparison.
Trend
This comparison measures the indicator’s values over multiple time periods.<br>The Mann-Kendall Test for Statistical Significance is used to evaluate the trend<br>over 4 to 10 periods of measure, subject to data availability and comparability.
Age-Adjusted ER Rate due to Dental Problems County: Salt Lake
Age-Adjusted ER Rate due to Dental Problems County: Salt Lake
23.1
ER visits per 10,000 population
(2020-2022)
Compared to:
UT Counties
The distribution is based on data from 26 Utah counties.
UT Value
(22.1)
The regional value is compared to the Utah State value.
Prior Value
(23.1)
Prior Value compares a measured value with the previously measured value. Confidence intervals were taken into account in determining the direction of the comparison.
Trend
This comparison measures the indicator’s values over multiple time periods.<br>The Mann-Kendall Test for Statistical Significance is used to evaluate the trend<br>over 4 to 10 periods of measure, subject to data availability and comparability.
Health / Other Conditions
Adults with Kidney Disease County: Salt Lake
Adults with Kidney Disease County: Salt Lake
2.8%
(2020-2022)
Compared to:
UT Value
(2.8%)
The regional value is compared to the Utah State value.
Prior Value
(2.6%)
Prior Value compares a measured value with the previously measured value. Confidence intervals were taken into account in determining the direction of the comparison.
Trend
This comparison measures the indicator’s values over multiple time periods.<br>The Mann-Kendall Test for Statistical Significance is used to evaluate the trend<br>over 4 to 10 periods of measure, subject to data availability and comparability.
Age-Adjusted Death Rate due to Kidney Disease County: Salt Lake
Age-Adjusted Death Rate due to Kidney Disease County: Salt Lake
10.9
Deaths per 100,000 population
(2019-2021)
Compared to:
UT Counties
(2018-2020)
The distribution is based on data from 29 Utah counties.
UT Value
(13.3)
The regional value is compared to the Utah State value.
US Value
(12.7 in 2020)
The regional value is compared to the national value. The source for the national value is Centers for Disease Control and Prevention
Prior Value
(740.7)
Prior Value compares a measured value with the previously measured value. Confidence intervals were taken into account in determining the direction of the comparison.
Trend
This comparison measures the indicator’s values over multiple time periods.<br>The Mann-Kendall Test for Statistical Significance is used to evaluate the trend<br>over 4 to 10 periods of measure, subject to data availability and comparability.
Age-Adjusted ER Rate due to Dehydration County: Salt Lake
Age-Adjusted ER Rate due to Dehydration County: Salt Lake
11.7
ER visits per 10,000 population 18+ years
(2020-2022)
Compared to:
UT Counties
The distribution is based on data from 25 Utah counties.
UT Value
(15.6)
The regional value is compared to the Utah State value.
Prior Value
(12.2)
Prior Value compares a measured value with the previously measured value. Confidence intervals were taken into account in determining the direction of the comparison.
Trend
This comparison measures the indicator’s values over multiple time periods.<br>The Mann-Kendall Test for Statistical Significance is used to evaluate the trend<br>over 4 to 10 periods of measure, subject to data availability and comparability.
Age-Adjusted ER Rate due to Urinary Tract Infections County: Salt Lake
Age-Adjusted ER Rate due to Urinary Tract Infections County: Salt Lake
57.6
ER visits per 10,000 population 18+ years
(2020-2022)
Compared to:
UT Counties
The distribution is based on data from 28 Utah counties.
UT Value
(62.6)
The regional value is compared to the Utah State value.
Prior Value
(55.0)
Prior Value compares a measured value with the previously measured value. Confidence intervals were taken into account in determining the direction of the comparison.
Trend
This comparison measures the indicator’s values over multiple time periods.<br>The Mann-Kendall Test for Statistical Significance is used to evaluate the trend<br>over 4 to 10 periods of measure, subject to data availability and comparability.
Age-Adjusted Hospitalization Rate due to Dehydration County: Salt Lake
Age-Adjusted Hospitalization Rate due to Dehydration County: Salt Lake
6.2
Hospitalizations per 10,000 population 18+ years
(2020-2022)
Compared to:
UT Counties
The distribution is based on data from 21 Utah counties.
UT Value
(7.1)
The regional value is compared to the Utah State value.
Prior Value
(6.5)
Prior Value compares a measured value with the previously measured value. Confidence intervals were taken into account in determining the direction of the comparison.
Trend
This comparison measures the indicator’s values over multiple time periods.<br>The Mann-Kendall Test for Statistical Significance is used to evaluate the trend<br>over 4 to 10 periods of measure, subject to data availability and comparability.
Health / Other Conditions
Age-Adjusted Hospitalization Rate due to Urinary Tract Infections
Value
Compared to:
Age-Adjusted Hospitalization Rate due to Urinary Tract Infections County: Salt Lake
Age-Adjusted Hospitalization Rate due to Urinary Tract Infections County: Salt Lake
4.9
Hospitalizations per 10,000 population 18+ years
(2020-2022)
Compared to:
UT Counties
The distribution is based on data from 22 Utah counties.
UT Value
(5.2)
The regional value is compared to the Utah State value.
Prior Value
(5.3)
Prior Value compares a measured value with the previously measured value. Confidence intervals were taken into account in determining the direction of the comparison.
Trend
This comparison measures the indicator’s values over multiple time periods.<br>The Mann-Kendall Test for Statistical Significance is used to evaluate the trend<br>over 4 to 10 periods of measure, subject to data availability and comparability.
Chronic Kidney Disease: Medicare Population County: Salt Lake
Chronic Kidney Disease: Medicare Population County: Salt Lake
20.0%
(2022)
Compared to:
UT Counties
The distribution is based on data from 29 Utah counties.
U.S. Counties
The distribution is based on data from 3,129 U.S. counties and county equivalents.
UT Value
(20.0%)
The regional value is compared to the Utah State value.
US Value
(18.0%)
The regional value is compared to the national value.
Prior Value
(20.0%)
Prior Value compares a measured value with the previously measured value. Confidence intervals were not taken into account in determining the direction of the comparison.
Trend
This comparison measures the indicator’s values over multiple time periods.<br>The Mann-Kendall Test for Statistical Significance is used to evaluate the trend<br>over 4 to 10 periods of measure, subject to data availability and comparability.
Osteoporosis: Medicare Population County: Salt Lake
Osteoporosis: Medicare Population County: Salt Lake
13.0%
(2022)
Compared to:
UT Counties
The distribution is based on data from 29 Utah counties.
U.S. Counties
The distribution is based on data from 3,129 U.S. counties and county equivalents.
UT Value
(12.0%)
The regional value is compared to the Utah State value.
US Value
(11.0%)
The regional value is compared to the national value.
Prior Value
(12.0%)
Prior Value compares a measured value with the previously measured value. Confidence intervals were not taken into account in determining the direction of the comparison.
Trend
This comparison measures the indicator’s values over multiple time periods.<br>The Mann-Kendall Test for Statistical Significance is used to evaluate the trend<br>over 4 to 10 periods of measure, subject to data availability and comparability.
Health / Other Conditions
Rheumatoid Arthritis or Osteoarthritis: Medicare Population
Value
Compared to:
Rheumatoid Arthritis or Osteoarthritis: Medicare Population County: Salt Lake
Rheumatoid Arthritis or Osteoarthritis: Medicare Population County: Salt Lake
35.0%
(2022)
Compared to:
UT Counties
The distribution is based on data from 29 Utah counties.
U.S. Counties
The distribution is based on data from 3,129 U.S. counties and county equivalents.
UT Value
(36.0%)
The regional value is compared to the Utah State value.
US Value
(35.0%)
The regional value is compared to the national value.
Prior Value
(34.0%)
Prior Value compares a measured value with the previously measured value. Confidence intervals were not taken into account in determining the direction of the comparison.
Trend
This comparison measures the indicator’s values over multiple time periods.<br>The Mann-Kendall Test for Statistical Significance is used to evaluate the trend<br>over 4 to 10 periods of measure, subject to data availability and comparability.
Health / Physical Activity
Adults 20+ who are Sedentary County: Salt Lake
Adults 20+ who are Sedentary County: Salt Lake
16.4%
(2021)
Compared to:
UT Counties
The distribution is based on data from 29 Utah counties.
U.S. Counties
The distribution is based on data from 3,074 U.S. counties and county equivalents.
Prior Value
(16.0%)
Prior Value compares a measured value with the previously measured value. Confidence intervals were taken into account in determining the direction of the comparison.
Trend
This comparison measures the indicator’s values over multiple time periods.<br>The Mann-Kendall Test for Statistical Significance is used to evaluate the trend<br>over 4 to 10 periods of measure, subject to data availability and comparability.
Adults Engaging in Regular Physical Activity County: Salt Lake
Adults Engaging in Regular Physical Activity County: Salt Lake
24.4%
(2017-2019)
Compared to:
UT Counties
The distribution is based on data from 23 Utah counties.
UT Value
(23.9%)
The regional value is compared to the Utah State value.
Prior Value
(24.7%)
Prior Value compares a measured value with the previously measured value. Confidence intervals were taken into account in determining the direction of the comparison.
Trend
This comparison measures the indicator’s values over multiple time periods.<br>The Mann-Kendall Test for Statistical Significance is used to evaluate the trend<br>over 4 to 10 periods of measure, subject to data availability and comparability.
HP 2030 Target
(29.7%)
<div>PA-05: Increase the proportion of adults who do enough aerobic and muscle-strengthening activity <strong>(LEADING HEALTH INDICATOR)</strong></div>
Health / Prevention & Safety
Age-Adjusted Death Rate due to Falls County: Salt Lake
Age-Adjusted Death Rate due to Falls County: Salt Lake
13.9
Deaths per 100,000 population
(2019-2021)
Compared to:
UT Value
(13.8)
The regional value is compared to the Utah State value.
US Value
(10.3 in 2020)
The regional value is compared to the national value. The source for the national value is Centers for Disease Control and Prevention
Prior Value
(13.0)
Prior Value compares a measured value with the previously measured value. Confidence intervals were taken into account in determining the direction of the comparison.
Trend
This comparison measures the indicator’s values over multiple time periods.<br>The Mann-Kendall Test for Statistical Significance is used to evaluate the trend<br>over 4 to 10 periods of measure, subject to data availability and comparability.
Age-Adjusted Death Rate due to Firearms County: Salt Lake
Age-Adjusted Death Rate due to Firearms County: Salt Lake
12.4
Deaths per 100,000 population
(2018-2020)
Compared to:
U.S. Counties
The distribution is based on data from 1,083 U.S. counties and county equivalents.
UT Value
(12.6)
The regional value is compared to the Utah State value.
US Value
(12.0)
The regional value is compared to the national value.
Prior Value
(12.5)
Prior Value compares a measured value with the previously measured value. Confidence intervals were taken into account in determining the direction of the comparison.
Trend
This comparison measures the indicator’s values over multiple time periods.<br>The Mann-Kendall Test for Statistical Significance is used to evaluate the trend<br>over 4 to 10 periods of measure, subject to data availability and comparability.
HP 2030 Target
(10.7)
Health / Prevention & Safety
Age-Adjusted Death Rate due to Unintentional Injuries
Value
Compared to:
Age-Adjusted Death Rate due to Unintentional Injuries County: Salt Lake
Age-Adjusted Death Rate due to Unintentional Injuries County: Salt Lake
49.8
Deaths per 100,000 population
(2019-2021)
Compared to:
UT Counties
(2018-2020)
The distribution is based on data from 23 Utah counties.
UT Value
(48.6)
The regional value is compared to the Utah State value.
US Value
(57.6 in 2020)
The regional value is compared to the national value. The source for the national value is Centers for Disease Control and Prevention
Prior Value
(48.6)
Prior Value compares a measured value with the previously measured value. Confidence intervals were taken into account in determining the direction of the comparison.
Trend
This comparison measures the indicator’s values over multiple time periods.<br>The Mann-Kendall Test for Statistical Significance is used to evaluate the trend<br>over 4 to 10 periods of measure, subject to data availability and comparability.
HP 2030 Target
(43.2)
Age-Adjusted ER Rate due to Unintentional Falls County: Salt Lake
Age-Adjusted ER Rate due to Unintentional Falls County: Salt Lake
165.6
ER visits per 10,000 population 18+ years
(2020-2022)
Compared to:
UT Counties
The distribution is based on data from 29 Utah counties.
UT Value
(178.6)
The regional value is compared to the Utah State value.
Prior Value
(160.7)
Prior Value compares a measured value with the previously measured value. Confidence intervals were taken into account in determining the direction of the comparison.
Trend
This comparison measures the indicator’s values over multiple time periods.<br>The Mann-Kendall Test for Statistical Significance is used to evaluate the trend<br>over 4 to 10 periods of measure, subject to data availability and comparability.
Health / Prevention & Safety
Age-Adjusted Hospitalization Rate due to Unintentional Falls
Value
Compared to:
Age-Adjusted Hospitalization Rate due to Unintentional Falls County: Salt Lake
Age-Adjusted Hospitalization Rate due to Unintentional Falls County: Salt Lake
37.8
Hospitalizations per 10,000 population 18+ years
(2020-2022)
Compared to:
UT Counties
The distribution is based on data from 28 Utah counties.
UT Value
(39.0)
The regional value is compared to the Utah State value.
Prior Value
(38.5)
Prior Value compares a measured value with the previously measured value. Confidence intervals were taken into account in determining the direction of the comparison.
Trend
This comparison measures the indicator’s values over multiple time periods.<br>The Mann-Kendall Test for Statistical Significance is used to evaluate the trend<br>over 4 to 10 periods of measure, subject to data availability and comparability.
Health / Respiratory Diseases
Adults with COPD County: Salt Lake
Adults with COPD County: Salt Lake
4.5%
Percent of adults
(2019-2021)
Compared to:
UT Counties
(2017-2019)
The distribution is based on data from 23 Utah counties.
UT Value
(4.3%)
The regional value is compared to the Utah State value.
Prior Value
(4.5%)
Prior Value compares a measured value with the previously measured value. Confidence intervals were taken into account in determining the direction of the comparison.
Trend
This comparison measures the indicator’s values over multiple time periods.<br>The Mann-Kendall Test for Statistical Significance is used to evaluate the trend<br>over 4 to 10 periods of measure, subject to data availability and comparability.
Adults with Current Asthma County: Salt Lake
Adults with Current Asthma County: Salt Lake
10.1%
(2020-2022)
Compared to:
UT Counties
The distribution is based on data from 23 Utah counties.
UT Value
(10.5%)
The regional value is compared to the Utah State value.
Prior Value
(10.1%)
Prior Value compares a measured value with the previously measured value. Confidence intervals were taken into account in determining the direction of the comparison.
Trend
This comparison measures the indicator’s values over multiple time periods.<br>The Mann-Kendall Test for Statistical Significance is used to evaluate the trend<br>over 4 to 10 periods of measure, subject to data availability and comparability.
Age-Adjusted ER Rate due to Adult Asthma County: Salt Lake
Age-Adjusted ER Rate due to Adult Asthma County: Salt Lake
12.4
ER visits per 10,000 population 18+ years
(2020-2022)
Compared to:
UT Counties
The distribution is based on data from 23 Utah counties.
UT Value
(11.2)
The regional value is compared to the Utah State value.
Prior Value
(12.1)
Prior Value compares a measured value with the previously measured value. Confidence intervals were taken into account in determining the direction of the comparison.
Trend
This comparison measures the indicator’s values over multiple time periods.<br>The Mann-Kendall Test for Statistical Significance is used to evaluate the trend<br>over 4 to 10 periods of measure, subject to data availability and comparability.
Age-Adjusted ER Rate due to Asthma County: Salt Lake
Age-Adjusted ER Rate due to Asthma County: Salt Lake
13.0
ER visits per 10,000 population
(2020-2022)
Compared to:
UT Counties
The distribution is based on data from 24 Utah counties.
UT Value
(11.1)
The regional value is compared to the Utah State value.
Prior Value
(12.3)
Prior Value compares a measured value with the previously measured value. Confidence intervals were taken into account in determining the direction of the comparison.
Trend
This comparison measures the indicator’s values over multiple time periods.<br>The Mann-Kendall Test for Statistical Significance is used to evaluate the trend<br>over 4 to 10 periods of measure, subject to data availability and comparability.
Age-Adjusted ER Rate due to COPD County: Salt Lake
Age-Adjusted ER Rate due to COPD County: Salt Lake
8.4
ER visits per 10,000 population 18+ years
(2020-2022)
Compared to:
UT Counties
The distribution is based on data from 23 Utah counties.
UT Value
(9.6)
The regional value is compared to the Utah State value.
Prior Value
(9.0)
Prior Value compares a measured value with the previously measured value. Confidence intervals were taken into account in determining the direction of the comparison.
Trend
This comparison measures the indicator’s values over multiple time periods.<br>The Mann-Kendall Test for Statistical Significance is used to evaluate the trend<br>over 4 to 10 periods of measure, subject to data availability and comparability.
Age-Adjusted ER Rate due to Pediatric Asthma County: Salt Lake
Age-Adjusted ER Rate due to Pediatric Asthma County: Salt Lake
14.5
ER visits per 10,000 population under 18 years
(2020-2022)
Compared to:
UT Counties
(2019-2021)
The distribution is based on data from 20 Utah counties.
UT Value
(11.1)
The regional value is compared to the Utah State value.
Prior Value
(13.0)
Prior Value compares a measured value with the previously measured value. Confidence intervals were taken into account in determining the direction of the comparison.
Trend
This comparison measures the indicator’s values over multiple time periods.<br>The Mann-Kendall Test for Statistical Significance is used to evaluate the trend<br>over 4 to 10 periods of measure, subject to data availability and comparability.
Health / Respiratory Diseases
Age-Adjusted Hospitalization Rate due to Adult Asthma
Value
Compared to:
Age-Adjusted Hospitalization Rate due to Adult Asthma County: Salt Lake
Age-Adjusted Hospitalization Rate due to Adult Asthma County: Salt Lake
1.9
Hospitalizations per 10,000 population 18+ years
(2020-2022)
Compared to:
UT Value
(1.5)
The regional value is compared to the Utah State value.
Prior Value
(1.8)
Prior Value compares a measured value with the previously measured value. Confidence intervals were taken into account in determining the direction of the comparison.
Trend
This comparison measures the indicator’s values over multiple time periods.<br>The Mann-Kendall Test for Statistical Significance is used to evaluate the trend<br>over 4 to 10 periods of measure, subject to data availability and comparability.
Age-Adjusted Hospitalization Rate due to Asthma County: Salt Lake
Age-Adjusted Hospitalization Rate due to Asthma County: Salt Lake
2.6
Hospitalizations per 10,000 population
(2020-2022)
Compared to:
UT Value
(2.1)
The regional value is compared to the Utah State value.
Prior Value
(2.4)
Prior Value compares a measured value with the previously measured value. Confidence intervals were taken into account in determining the direction of the comparison.
Trend
This comparison measures the indicator’s values over multiple time periods.<br>The Mann-Kendall Test for Statistical Significance is used to evaluate the trend<br>over 4 to 10 periods of measure, subject to data availability and comparability.
Age-Adjusted Hospitalization Rate due to COPD County: Salt Lake
Age-Adjusted Hospitalization Rate due to COPD County: Salt Lake
3.6
Hospitalizations per 10,000 population 18+ years
(2020-2022)
Compared to:
UT Counties
(2019-2021)
The distribution is based on data from 21 Utah counties.
UT Value
(3.6)
The regional value is compared to the Utah State value.
Prior Value
(4.0)
Prior Value compares a measured value with the previously measured value. Confidence intervals were taken into account in determining the direction of the comparison.
Trend
This comparison measures the indicator’s values over multiple time periods.<br>The Mann-Kendall Test for Statistical Significance is used to evaluate the trend<br>over 4 to 10 periods of measure, subject to data availability and comparability.
Health / Respiratory Diseases
Age-Adjusted Hospitalization Rate due to Pediatric Asthma
Value
Compared to:
Age-Adjusted Hospitalization Rate due to Pediatric Asthma County: Salt Lake
Age-Adjusted Hospitalization Rate due to Pediatric Asthma County: Salt Lake
4.7
Hospitalizations per 10,000 population under 18 years
(2020-2022)
Compared to:
UT Value
(3.8)
The regional value is compared to the Utah State value.
Prior Value
(4.1)
Prior Value compares a measured value with the previously measured value. Confidence intervals were taken into account in determining the direction of the comparison.
Trend
This comparison measures the indicator’s values over multiple time periods.<br>The Mann-Kendall Test for Statistical Significance is used to evaluate the trend<br>over 4 to 10 periods of measure, subject to data availability and comparability.
Asthma: Medicare Population County: Salt Lake
Asthma: Medicare Population County: Salt Lake
9.0%
(2022)
Compared to:
UT Counties
The distribution is based on data from 29 Utah counties.
U.S. Counties
The distribution is based on data from 3,129 U.S. counties and county equivalents.
UT Value
(8.0%)
The regional value is compared to the Utah State value.
US Value
(7.0%)
The regional value is compared to the national value.
Prior Value
(9.0%)
Prior Value compares a measured value with the previously measured value. Confidence intervals were not taken into account in determining the direction of the comparison.
Trend
This comparison measures the indicator’s values over multiple time periods.<br>The Mann-Kendall Test for Statistical Significance is used to evaluate the trend<br>over 4 to 10 periods of measure, subject to data availability and comparability.
COPD: Medicare Population County: Salt Lake
COPD: Medicare Population County: Salt Lake
7.0%
(2022)
Compared to:
UT Counties
The distribution is based on data from 29 Utah counties.
U.S. Counties
The distribution is based on data from 3,129 U.S. counties and county equivalents.
UT Value
(7.0%)
The regional value is compared to the Utah State value.
US Value
(11.0%)
The regional value is compared to the national value.
Prior Value
(7.0%)
Prior Value compares a measured value with the previously measured value. Confidence intervals were not taken into account in determining the direction of the comparison.
Trend
This comparison measures the indicator’s values over multiple time periods.<br>The Mann-Kendall Test for Statistical Significance is used to evaluate the trend<br>over 4 to 10 periods of measure, subject to data availability and comparability.
Health / Sexually Transmitted Infections
Chlamydia Incidence Rate County: Salt Lake
Chlamydia Incidence Rate County: Salt Lake
485.7
Cases per 100,000 population
(2022)
Compared to:
UT Counties
The distribution is based on data from 29 Utah counties.
U.S. Counties
The distribution is based on data from 3,132 U.S. counties and county equivalents.
UT Value
(328.6)
The regional value is compared to the Utah State value.
US Value
(495.0)
The regional value is compared to the national value.
Prior Value
(491.2)
Prior Value compares a measured value with the previously measured value. Confidence intervals were not taken into account in determining the direction of the comparison.
Trend
This comparison measures the indicator’s values over multiple time periods.<br>The Mann-Kendall Test for Statistical Significance is used to evaluate the trend<br>over 4 to 10 periods of measure, subject to data availability and comparability.
Gonorrhea Incidence Rate County: Salt Lake
Gonorrhea Incidence Rate County: Salt Lake
173.6
Cases per 100,000 population
(2022)
Compared to:
UT Counties
The distribution is based on data from 29 Utah counties.
U.S. Counties
The distribution is based on data from 3,132 U.S. counties and county equivalents.
UT Value
(93.8)
The regional value is compared to the Utah State value.
US Value
(194.4)
The regional value is compared to the national value.
Prior Value
(197.4)
Prior Value compares a measured value with the previously measured value. Confidence intervals were not taken into account in determining the direction of the comparison.
Trend
This comparison measures the indicator’s values over multiple time periods.<br>The Mann-Kendall Test for Statistical Significance is used to evaluate the trend<br>over 4 to 10 periods of measure, subject to data availability and comparability.
Health / Tobacco Use
Adults who Smoke County: Salt Lake
Adults who Smoke County: Salt Lake
8.2%
(2020-2022)
Compared to:
UT Counties
The distribution is based on data from 22 Utah counties.
UT Value
(7.5%)
The regional value is compared to the Utah State value.
Prior Value
(8.7%)
Prior Value compares a measured value with the previously measured value. Confidence intervals were taken into account in determining the direction of the comparison.
Trend
This comparison measures the indicator’s values over multiple time periods.<br>The Mann-Kendall Test for Statistical Significance is used to evaluate the trend<br>over 4 to 10 periods of measure, subject to data availability and comparability.
HP 2030 Target
(6.1%)
<div>TU-02: Reduce current cigarette smoking in adults <strong>(LEADING HEALTH INDICATOR)</strong></div>
Health / Weight Status
Adults Who Are Obese County: Salt Lake
Adults Who Are Obese County: Salt Lake
31.1%
(2020-2022)
Compared to:
UT Counties
The distribution is based on data from 27 Utah counties.
UT Value
(31.0%)
The regional value is compared to the Utah State value.
Prior Value
(29.9%)
Prior Value compares a measured value with the previously measured value. Confidence intervals were taken into account in determining the direction of the comparison.
Trend
This comparison measures the indicator’s values over multiple time periods.<br>The Mann-Kendall Test for Statistical Significance is used to evaluate the trend<br>over 4 to 10 periods of measure, subject to data availability and comparability.
Adults who are Overweight or Obese County: Salt Lake
Adults who are Overweight or Obese County: Salt Lake
65.0%
(2020-2022)
Compared to:
UT Counties
The distribution is based on data from 29 Utah counties.
UT Value
(65.3%)
The regional value is compared to the Utah State value.
Prior Value
(64.3%)
Prior Value compares a measured value with the previously measured value. Confidence intervals were taken into account in determining the direction of the comparison.
Trend
This comparison measures the indicator’s values over multiple time periods.<br>The Mann-Kendall Test for Statistical Significance is used to evaluate the trend<br>over 4 to 10 periods of measure, subject to data availability and comparability.
Health / Wellness & Lifestyle
Health / Wellness & Lifestyle
Self-Reported General Health Assessment: Good or Better
Value
Compared to:
Self-Reported General Health Assessment: Good or Better County: Salt Lake
Self-Reported General Health Assessment: Good or Better County: Salt Lake
87.3%
(2020-2022)
Compared to:
UT Counties
The distribution is based on data from 27 Utah counties.
UT Value
(87.3%)
The regional value is compared to the Utah State value.
Prior Value
(87.4%)
Prior Value compares a measured value with the previously measured value. Confidence intervals were not taken into account in determining the direction of the comparison.
Trend
This comparison measures the indicator’s values over multiple time periods.<br>The Mann-Kendall Test for Statistical Significance is used to evaluate the trend<br>over 4 to 10 periods of measure, subject to data availability and comparability.
Community / Crime & Crime Prevention
Age-Adjusted Death Rate due to Homicide County: Salt Lake
Age-Adjusted Death Rate due to Homicide County: Salt Lake
3.5
Deaths per 100,000 population
(2018-2020)
Compared to:
U.S. Counties
The distribution is based on data from 495 U.S. counties and county equivalents.
UT Value
(2.6)
The regional value is compared to the Utah State value.
US Value
(6.6)
The regional value is compared to the national value.
Prior Value
(3.1)
Prior Value compares a measured value with the previously measured value. Confidence intervals were taken into account in determining the direction of the comparison.
Trend
This comparison measures the indicator’s values over multiple time periods.<br>The Mann-Kendall Test for Statistical Significance is used to evaluate the trend<br>over 4 to 10 periods of measure, subject to data availability and comparability.
HP 2030 Target
(5.5)
<div>IVP-09: Reduce homicides <strong>(LEADING HEALTH INDICATOR)</strong></div>
Community / Demographics
Foreign Born Persons County: Salt Lake
Foreign Born Persons County: Salt Lake
12.9%
(2018-2022)
Compared to:
UT Value
(8.4%)
The regional value is compared to the Utah State value.
US Value
(13.7%)
The regional value is compared to the national value.
Trend
This comparison measures the indicator’s values over multiple time periods.<br>The Mann-Kendall Test for Statistical Significance is used to evaluate the trend<br>over 4 to 10 periods of measure, subject to data availability and comparability.
Veteran Population County: Salt Lake
Veteran Population County: Salt Lake
4.2%
(2018-2022)
Compared to:
UT Value
(5.0%)
The regional value is compared to the Utah State value.
US Value
(6.6%)
The regional value is compared to the national value.
Trend
This comparison measures the indicator’s values over multiple time periods.<br>The Mann-Kendall Test for Statistical Significance is used to evaluate the trend<br>over 4 to 10 periods of measure, subject to data availability and comparability.
