
Indicator Gauge Icon Legend
Legend Colors
Red is bad, green is good, blue is not statistically different/neutral.
Compared to Distribution
 the value is in the best half of communities.
 the value is in the 2nd worst quarter of communities.
 the value is in the worst quarter of communities.
Compared to Target
 meets target;
  does not meet target.
Compared to a Single Value
 lower than the comparison value;
 higher than the comparison value;
 not statistically different from comparison value.
Trend

 non-significant change over time;
 significant change over time;
  no change over time.
Compared to Prior Value
 higher than the previous measurement period;
 lower than the previous measurement period;
 no statistically different change from previous measurement period.
 Significantly better than the overall value
 Significantly worse than the overall value
 No significant difference with the overall value
 No data on significance available
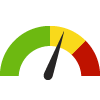
Opioid Prescriptions (≥90 Morphine Milligram Equivalents) Dispensed
Measurement Period: 2021
This indicator is archived and is no longer being updated. Click to learn more
This indicator shows the rate of opioid prescriptions dispensed per 1,000 population that are greater than or equal to 90 morphine milligram equivalents (MME).
Why is this important?
Opioids are a class of drug that are used to reduce pain. Opioids include prescription drugs such as oxycodone and morphine, illegal drugs such as heroin, as well as synthetic opioids such as fentanyl. Opioid use and abuse are a serious public health issue but preventative actions such as limiting the number of opioid prescriptions, providing naloxone with an opioid prescription, and more are key in reducing morbidity and mortality due to opioid use and abuse.
Morphine milligram equivalents (MME) is an equivalency measurement used as a gauge of the overdose potential of the amount of opioid being given at a particular time. Based on CDC recommendations, patients are advised to not exceed over 90 MME/day in opioid prescriptions.
Nationally, the majority of overdose deaths involve an opioid and at least half of all overdose deaths involving an opioid involved a prescription opioid. Since 1999, the rate of overdose deaths involving opioids (including prescription opioid pain relievers) has nearly quadrupled. According to the CDC, overdoses involving prescription opioid pain relievers are a driving factor in the increase in opioid overdose deaths.
62.4
prescriptions per 1,000 population
Source:
Utah Department of Health
Measurement period: 2021
Maintained by: Conduent Healthy Communities Institute
Last update: November 2023
Measurement period: 2021
Maintained by: Conduent Healthy Communities Institute
Last update: November 2023
Compared to
Technical note: Does not include prescriptions for buprenorphine
Graph Selections

Data Source
- Utah Department of Health
Maintained By: Conduent Healthy Communities Institute (Methodology)
Filed under: Health / Alcohol & Drug Use, Health / Medications & Prescriptions, Clinical Care