
Search for Indicators
Emergency Department and Hospitalization Rates
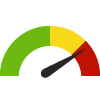
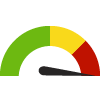
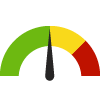
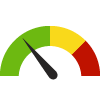
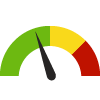
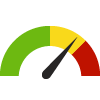
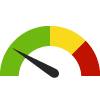
Indicator Gauge Icon Legend
Legend Colors
Red is bad, green is good, blue is not statistically different/neutral.
Compared to Distribution
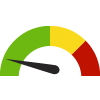 the value is in the best half of communities.
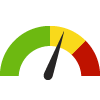 the value is in the 2nd worst quarter of communities.
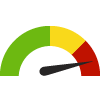 the value is in the worst quarter of communities.
Compared to Target
 meets target;
  does not meet target.
Compared to a Single Value
 lower than the comparison value;
 higher than the comparison value;
 not statistically different from comparison value.
Trend

 non-significant change over time;
 significant change over time;
  no change over time.
Compared to Prior Value
 higher than the previous measurement period;
 lower than the previous measurement period;
 no statistically different change from previous measurement period.
County: Salt Lake
Health / Alcohol & Drug Use
Value
Compared to:
County: Salt Lake Age-Adjusted ER Rate due to Adolescent Alcohol Use
County: Salt Lake Age-Adjusted ER Rate due to Adolescent Alcohol Use
6.5
ER visits per 10,000 population aged 10-17
(2020-2022)
Compared to:
UT Value
(6.5)
The regional value is compared to the Utah State value.
Prior Value
(7.1)
Prior Value compares a measured value with the previously measured value. Confidence intervals were taken into account in determining the direction of the comparison.
Trend
This comparison measures the indicator’s values over multiple time periods.<br>The Mann-Kendall Test for Statistical Significance is used to evaluate the trend<br>over 4 to 10 periods of measure, subject to data availability and comparability.
County: Salt Lake Age-Adjusted ER Rate due to Adult Alcohol Use
County: Salt Lake Age-Adjusted ER Rate due to Adult Alcohol Use
38.1
ER visits per 10,000 population 18+ years
(2020-2022)
Compared to:


UT Counties
The distribution is based on data from 25 Utah counties.
UT Value
(32.9)
The regional value is compared to the Utah State value.
Prior Value
(39.5)
Prior Value compares a measured value with the previously measured value. Confidence intervals were taken into account in determining the direction of the comparison.
Trend
This comparison measures the indicator’s values over multiple time periods.<br>The Mann-Kendall Test for Statistical Significance is used to evaluate the trend<br>over 4 to 10 periods of measure, subject to data availability and comparability.
County: Salt Lake Age-Adjusted ER Rate due to Opioid Use
County: Salt Lake Age-Adjusted ER Rate due to Opioid Use
18.9
ER visits per 10,000 population 18+ years
(2020-2022)
Compared to:


UT Counties
The distribution is based on data from 21 Utah counties.
UT Value
(12.6)
The regional value is compared to the Utah State value.
Prior Value
(17.5)
Prior Value compares a measured value with the previously measured value. Confidence intervals were taken into account in determining the direction of the comparison.
Trend
This comparison measures the indicator’s values over multiple time periods.<br>The Mann-Kendall Test for Statistical Significance is used to evaluate the trend<br>over 4 to 10 periods of measure, subject to data availability and comparability.
County: Salt Lake Age-Adjusted ER Rate due to Substance Use
County: Salt Lake Age-Adjusted ER Rate due to Substance Use
40.1
ER visits per 10,000 population 18+ years
(2020-2022)
Compared to:
UT Counties
The distribution is based on data from 25 Utah counties.
UT Value
(26.3)
The regional value is compared to the Utah State value.
Prior Value
(38.7)
Prior Value compares a measured value with the previously measured value. Confidence intervals were taken into account in determining the direction of the comparison.
Trend
This comparison measures the indicator’s values over multiple time periods.<br>The Mann-Kendall Test for Statistical Significance is used to evaluate the trend<br>over 4 to 10 periods of measure, subject to data availability and comparability.
County: Salt Lake Age-Adjusted Hospitalization Rate due to Adolescent Alcohol Use
County: Salt Lake Age-Adjusted Hospitalization Rate due to Adolescent Alcohol Use
2.1
Hospitalizations per 10,000 population aged 10-17
(2020-2022)
Compared to:
UT Value
(2.2)
The regional value is compared to the Utah State value.
Prior Value
(2.2)
Prior Value compares a measured value with the previously measured value. Confidence intervals were taken into account in determining the direction of the comparison.
Trend
This comparison measures the indicator’s values over multiple time periods.<br>The Mann-Kendall Test for Statistical Significance is used to evaluate the trend<br>over 4 to 10 periods of measure, subject to data availability and comparability.
County: Salt Lake Age-Adjusted Hospitalization Rate due to Adult Alcohol Use
County: Salt Lake Age-Adjusted Hospitalization Rate due to Adult Alcohol Use
24.1
Hospitalizations per 10,000 population 18+ years
(2020-2022)
Compared to:
UT Counties
The distribution is based on data from 25 Utah counties.
UT Value
(21.0)
The regional value is compared to the Utah State value.
Prior Value
(23.7)
Prior Value compares a measured value with the previously measured value. Confidence intervals were taken into account in determining the direction of the comparison.
Trend
This comparison measures the indicator’s values over multiple time periods.<br>The Mann-Kendall Test for Statistical Significance is used to evaluate the trend<br>over 4 to 10 periods of measure, subject to data availability and comparability.
County: Salt Lake Age-Adjusted Hospitalization Rate due to Opioid Use
County: Salt Lake Age-Adjusted Hospitalization Rate due to Opioid Use
4.9
Hospitalizations per 10,000 population 18+ years
(2020-2022)
Compared to:
UT Value
(5.5)
The regional value is compared to the Utah State value.
Prior Value
(5.6)
Prior Value compares a measured value with the previously measured value. Confidence intervals were taken into account in determining the direction of the comparison.
Trend
This comparison measures the indicator’s values over multiple time periods.<br>The Mann-Kendall Test for Statistical Significance is used to evaluate the trend<br>over 4 to 10 periods of measure, subject to data availability and comparability.
County: Salt Lake Age-Adjusted Hospitalization Rate due to Substance Use
County: Salt Lake Age-Adjusted Hospitalization Rate due to Substance Use
7.7
Hospitalizations per 10,000 population 18+ years
(2020-2022)
Compared to:
UT Counties
The distribution is based on data from 20 Utah counties.
UT Value
(7.5)
The regional value is compared to the Utah State value.
Prior Value
(8.4)
Prior Value compares a measured value with the previously measured value. Confidence intervals were taken into account in determining the direction of the comparison.
Trend
This comparison measures the indicator’s values over multiple time periods.<br>The Mann-Kendall Test for Statistical Significance is used to evaluate the trend<br>over 4 to 10 periods of measure, subject to data availability and comparability.
County: Salt Lake
Health / Diabetes
Value
Compared to:
County: Salt Lake Age-Adjusted ER Rate due to Diabetes
County: Salt Lake Age-Adjusted ER Rate due to Diabetes
18.6
ER visits per 10,000 population 18+ years
(2020-2022)
Compared to:
UT Counties
The distribution is based on data from 24 Utah counties.
UT Value
(18.6)
The regional value is compared to the Utah State value.
Prior Value
(18.2)
Prior Value compares a measured value with the previously measured value. Confidence intervals were taken into account in determining the direction of the comparison.
Trend
This comparison measures the indicator’s values over multiple time periods.<br>The Mann-Kendall Test for Statistical Significance is used to evaluate the trend<br>over 4 to 10 periods of measure, subject to data availability and comparability.
County: Salt Lake Age-Adjusted ER Rate due to Long-Term Complications of Diabetes
County: Salt Lake Age-Adjusted ER Rate due to Long-Term Complications of Diabetes
4.1
ER visits per 10,000 population 18+ years
(2020-2022)
Compared to:
UT Value
(4.0)
The regional value is compared to the Utah State value.
Prior Value
(4.2)
Prior Value compares a measured value with the previously measured value. Confidence intervals were taken into account in determining the direction of the comparison.
Trend
This comparison measures the indicator’s values over multiple time periods.<br>The Mann-Kendall Test for Statistical Significance is used to evaluate the trend<br>over 4 to 10 periods of measure, subject to data availability and comparability.
County: Salt Lake Age-Adjusted ER Rate due to Short-Term Complications of Diabetes
County: Salt Lake Age-Adjusted ER Rate due to Short-Term Complications of Diabetes
1.1
ER visits per 10,000 population 18+ years
(2020-2022)
Compared to:
UT Value
(1.2)
The regional value is compared to the Utah State value.
Prior Value
(1.2)
Prior Value compares a measured value with the previously measured value. Confidence intervals were taken into account in determining the direction of the comparison.
Trend
This comparison measures the indicator’s values over multiple time periods.<br>The Mann-Kendall Test for Statistical Significance is used to evaluate the trend<br>over 4 to 10 periods of measure, subject to data availability and comparability.
County: Salt Lake Age-Adjusted ER Rate due to Type 2 Diabetes
County: Salt Lake Age-Adjusted ER Rate due to Type 2 Diabetes
15.0
ER visits per 10,000 population 18+ years
(2020-2022)
Compared to:
UT Counties
The distribution is based on data from 24 Utah counties.
UT Value
(14.6)
The regional value is compared to the Utah State value.
Prior Value
(14.7)
Prior Value compares a measured value with the previously measured value. Confidence intervals were taken into account in determining the direction of the comparison.
Trend
This comparison measures the indicator’s values over multiple time periods.<br>The Mann-Kendall Test for Statistical Significance is used to evaluate the trend<br>over 4 to 10 periods of measure, subject to data availability and comparability.
County: Salt Lake Age-Adjusted ER Rate due to Uncontrolled Diabetes
County: Salt Lake Age-Adjusted ER Rate due to Uncontrolled Diabetes
12.6
ER visits per 10,000 population 18+ years
(2020-2022)
Compared to:
UT Counties
The distribution is based on data from 23 Utah counties.
UT Value
(12.6)
The regional value is compared to the Utah State value.
Prior Value
(12.1)
Prior Value compares a measured value with the previously measured value. Confidence intervals were taken into account in determining the direction of the comparison.
Trend
This comparison measures the indicator’s values over multiple time periods.<br>The Mann-Kendall Test for Statistical Significance is used to evaluate the trend<br>over 4 to 10 periods of measure, subject to data availability and comparability.
County: Salt Lake Age-Adjusted Hospitalization Rate due to Diabetes
County: Salt Lake Age-Adjusted Hospitalization Rate due to Diabetes
13.4
Hospitalizations per 10,000 population 18+ years
(2020-2022)
Compared to:
UT Counties
The distribution is based on data from 24 Utah counties.
UT Value
(12.8)
The regional value is compared to the Utah State value.
Prior Value
(13.1)
Prior Value compares a measured value with the previously measured value. Confidence intervals were taken into account in determining the direction of the comparison.
Trend
This comparison measures the indicator’s values over multiple time periods.<br>The Mann-Kendall Test for Statistical Significance is used to evaluate the trend<br>over 4 to 10 periods of measure, subject to data availability and comparability.
5.1
Hospitalizations per 10,000 population 18+ years
(2020-2022)
Compared to:
UT Value
(4.8)
The regional value is compared to the Utah State value.
Prior Value
(4.8)
Prior Value compares a measured value with the previously measured value. Confidence intervals were taken into account in determining the direction of the comparison.
Trend
This comparison measures the indicator’s values over multiple time periods.<br>The Mann-Kendall Test for Statistical Significance is used to evaluate the trend<br>over 4 to 10 periods of measure, subject to data availability and comparability.
6.7
Hospitalizations per 10,000 population 18+ years
(2020-2022)
Compared to:
UT Value
(6.4)
The regional value is compared to the Utah State value.
Prior Value
(6.7)
Prior Value compares a measured value with the previously measured value. Confidence intervals were taken into account in determining the direction of the comparison.
Trend
This comparison measures the indicator’s values over multiple time periods.<br>The Mann-Kendall Test for Statistical Significance is used to evaluate the trend<br>over 4 to 10 periods of measure, subject to data availability and comparability.
County: Salt Lake Age-Adjusted Hospitalization Rate due to Type 2 Diabetes
County: Salt Lake Age-Adjusted Hospitalization Rate due to Type 2 Diabetes
8.7
Hospitalizations per 10,000 population 18+ years
(2020-2022)
Compared to:
UT Counties
The distribution is based on data from 22 Utah counties.
UT Value
(8.1)
The regional value is compared to the Utah State value.
Prior Value
(8.3)
Prior Value compares a measured value with the previously measured value. Confidence intervals were taken into account in determining the direction of the comparison.
Trend
This comparison measures the indicator’s values over multiple time periods.<br>The Mann-Kendall Test for Statistical Significance is used to evaluate the trend<br>over 4 to 10 periods of measure, subject to data availability and comparability.
County: Salt Lake Age-Adjusted Hospitalization Rate due to Uncontrolled Diabetes
County: Salt Lake Age-Adjusted Hospitalization Rate due to Uncontrolled Diabetes
1.7
Hospitalizations per 10,000 population 18+ years
(2020-2022)
Compared to:
UT Value
(1.6)
The regional value is compared to the Utah State value.
Prior Value
(1.6)
Prior Value compares a measured value with the previously measured value. Confidence intervals were taken into account in determining the direction of the comparison.
Trend
This comparison measures the indicator’s values over multiple time periods.<br>The Mann-Kendall Test for Statistical Significance is used to evaluate the trend<br>over 4 to 10 periods of measure, subject to data availability and comparability.
County: Salt Lake
Health / Heart Disease & Stroke
Value
Compared to:
County: Salt Lake Age-Adjusted ER Rate due to Heart Failure
County: Salt Lake Age-Adjusted ER Rate due to Heart Failure
6.1
ER visits per 10,000 population 18+ years
(2020-2022)
Compared to:
UT Counties
The distribution is based on data from 21 Utah counties.
UT Value
(6.7)
The regional value is compared to the Utah State value.
Prior Value
(5.3)
Prior Value compares a measured value with the previously measured value. Confidence intervals were taken into account in determining the direction of the comparison.
Trend
This comparison measures the indicator’s values over multiple time periods.<br>The Mann-Kendall Test for Statistical Significance is used to evaluate the trend<br>over 4 to 10 periods of measure, subject to data availability and comparability.
County: Salt Lake Age-Adjusted ER Rate due to Hypertension
County: Salt Lake Age-Adjusted ER Rate due to Hypertension
18.4
ER visits per 10,000 population 18+ years
(2020-2022)
Compared to:
UT Counties
The distribution is based on data from 25 Utah counties.
UT Value
(20.6)
The regional value is compared to the Utah State value.
Prior Value
(16.6)
Prior Value compares a measured value with the previously measured value. Confidence intervals were taken into account in determining the direction of the comparison.
Trend
This comparison measures the indicator’s values over multiple time periods.<br>The Mann-Kendall Test for Statistical Significance is used to evaluate the trend<br>over 4 to 10 periods of measure, subject to data availability and comparability.
County: Salt Lake Age-Adjusted Hospitalization Rate due to Heart Failure
County: Salt Lake Age-Adjusted Hospitalization Rate due to Heart Failure
21.1
Hospitalizations per 10,000 population 18+ years
(2020-2022)
Compared to:
UT Counties
The distribution is based on data from 24 Utah counties.
UT Value
(18.3)
The regional value is compared to the Utah State value.
Prior Value
(21.5)
Prior Value compares a measured value with the previously measured value. Confidence intervals were taken into account in determining the direction of the comparison.
Trend
This comparison measures the indicator’s values over multiple time periods.<br>The Mann-Kendall Test for Statistical Significance is used to evaluate the trend<br>over 4 to 10 periods of measure, subject to data availability and comparability.
County: Salt Lake Age-Adjusted Hospitalization Rate due to Hypertension
County: Salt Lake Age-Adjusted Hospitalization Rate due to Hypertension
2.2
Hospitalizations per 10,000 population 18+ years
(2020-2022)
Compared to:
UT Value
(2.0)
The regional value is compared to the Utah State value.
Prior Value
(2.2)
Prior Value compares a measured value with the previously measured value. Confidence intervals were taken into account in determining the direction of the comparison.
Trend
This comparison measures the indicator’s values over multiple time periods.<br>The Mann-Kendall Test for Statistical Significance is used to evaluate the trend<br>over 4 to 10 periods of measure, subject to data availability and comparability.
County: Salt Lake
Health / Immunizations & Infectious Diseases
Value
Compared to:
County: Salt Lake Age-Adjusted ER Rate due to Community Acquired Pneumonia
County: Salt Lake Age-Adjusted ER Rate due to Community Acquired Pneumonia
15.4
ER visits per 10,000 population 18+ years
(2020-2022)
Compared to:
UT Counties
The distribution is based on data from 26 Utah counties.
UT Value
(17.4)
The regional value is compared to the Utah State value.
Prior Value
(15.6)
Prior Value compares a measured value with the previously measured value. Confidence intervals were taken into account in determining the direction of the comparison.
Trend
This comparison measures the indicator’s values over multiple time periods.<br>The Mann-Kendall Test for Statistical Significance is used to evaluate the trend<br>over 4 to 10 periods of measure, subject to data availability and comparability.
County: Salt Lake Age-Adjusted ER Rate due to Hepatitis
County: Salt Lake Age-Adjusted ER Rate due to Hepatitis
0.8
ER visits per 10,000 population 18+ years
(2020-2022)
Compared to:
UT Value
(0.8)
The regional value is compared to the Utah State value.
Prior Value
(0.8)
Prior Value compares a measured value with the previously measured value. Confidence intervals were taken into account in determining the direction of the comparison.
Trend
This comparison measures the indicator’s values over multiple time periods.<br>The Mann-Kendall Test for Statistical Significance is used to evaluate the trend<br>over 4 to 10 periods of measure, subject to data availability and comparability.
13.9
ER visits per 10,000 population 18+ years
(2020-2022)
Compared to:
UT Counties
The distribution is based on data from 24 Utah counties.
UT Value
(13.6)
The regional value is compared to the Utah State value.
Prior Value
(11.1)
Prior Value compares a measured value with the previously measured value. Confidence intervals were taken into account in determining the direction of the comparison.
Trend
This comparison measures the indicator’s values over multiple time periods.<br>The Mann-Kendall Test for Statistical Significance is used to evaluate the trend<br>over 4 to 10 periods of measure, subject to data availability and comparability.
County: Salt Lake Age-Adjusted Hospitalization Rate due to Community Acquired Pneumonia
County: Salt Lake Age-Adjusted Hospitalization Rate due to Community Acquired Pneumonia
7.3
Hospitalizations per 10,000 population 18+ years
(2020-2022)
Compared to:
UT Counties
The distribution is based on data from 23 Utah counties.
UT Value
(8.1)
The regional value is compared to the Utah State value.
Prior Value
(8.1)
Prior Value compares a measured value with the previously measured value. Confidence intervals were taken into account in determining the direction of the comparison.
Trend
This comparison measures the indicator’s values over multiple time periods.<br>The Mann-Kendall Test for Statistical Significance is used to evaluate the trend<br>over 4 to 10 periods of measure, subject to data availability and comparability.
County: Salt Lake Age-Adjusted Hospitalization Rate due to Hepatitis
County: Salt Lake Age-Adjusted Hospitalization Rate due to Hepatitis
1.4
Hospitalizations per 10,000 population 18+ years
(2020-2022)
Compared to:
UT Value
(1.2)
The regional value is compared to the Utah State value.
Prior Value
(1.3)
Prior Value compares a measured value with the previously measured value. Confidence intervals were taken into account in determining the direction of the comparison.
Trend
This comparison measures the indicator’s values over multiple time periods.<br>The Mann-Kendall Test for Statistical Significance is used to evaluate the trend<br>over 4 to 10 periods of measure, subject to data availability and comparability.
1.7
Hospitalizations per 10,000 population 18+ years
(2020-2022)
Compared to:
UT Counties
(2019-2021)
The distribution is based on data from 20 Utah counties.
UT Value
(1.6)
The regional value is compared to the Utah State value.
Prior Value
(2.3)
Prior Value compares a measured value with the previously measured value. Confidence intervals were taken into account in determining the direction of the comparison.
Trend
This comparison measures the indicator’s values over multiple time periods.<br>The Mann-Kendall Test for Statistical Significance is used to evaluate the trend<br>over 4 to 10 periods of measure, subject to data availability and comparability.
County: Salt Lake
Health / Mental Health & Mental Disorders
Value
Compared to:
97.2
ER visits per 10,000 population aged 10-17
(2020-2022)
Compared to:
UT Counties
The distribution is based on data from 27 Utah counties.
UT Value
(95.8)
The regional value is compared to the Utah State value.
Prior Value
(98.1)
Prior Value compares a measured value with the previously measured value. Confidence intervals were taken into account in determining the direction of the comparison.
Trend
This comparison measures the indicator’s values over multiple time periods.<br>The Mann-Kendall Test for Statistical Significance is used to evaluate the trend<br>over 4 to 10 periods of measure, subject to data availability and comparability.
County: Salt Lake Age-Adjusted ER Rate due to Adult Mental Health
County: Salt Lake Age-Adjusted ER Rate due to Adult Mental Health
68.3
ER visits per 10,000 population 18+ years
(2020-2022)
Compared to:
UT Counties
The distribution is based on data from 27 Utah counties.
UT Value
(56.6)
The regional value is compared to the Utah State value.
Prior Value
(76.6)
Prior Value compares a measured value with the previously measured value. Confidence intervals were taken into account in determining the direction of the comparison.
Trend
This comparison measures the indicator’s values over multiple time periods.<br>The Mann-Kendall Test for Statistical Significance is used to evaluate the trend<br>over 4 to 10 periods of measure, subject to data availability and comparability.
48.0
ER visits per 10,000 population 18+ years
(2020-2022)
Compared to:
UT Counties
The distribution is based on data from 26 Utah counties.
UT Value
(37.3)
The regional value is compared to the Utah State value.
Prior Value
(49.3)
Prior Value compares a measured value with the previously measured value. Confidence intervals were taken into account in determining the direction of the comparison.
Trend
This comparison measures the indicator’s values over multiple time periods.<br>The Mann-Kendall Test for Statistical Significance is used to evaluate the trend<br>over 4 to 10 periods of measure, subject to data availability and comparability.
County: Salt Lake Age-Adjusted ER Rate due to Pediatric Mental Health
County: Salt Lake Age-Adjusted ER Rate due to Pediatric Mental Health
35.5
ER visits per 10,000 population under 18 years
(2020-2022)
Compared to:
UT Counties
The distribution is based on data from 25 Utah counties.
UT Value
(32.4)
The regional value is compared to the Utah State value.
Prior Value
(44.3)
Prior Value compares a measured value with the previously measured value. Confidence intervals were taken into account in determining the direction of the comparison.
Trend
This comparison measures the indicator’s values over multiple time periods.<br>The Mann-Kendall Test for Statistical Significance is used to evaluate the trend<br>over 4 to 10 periods of measure, subject to data availability and comparability.
55.0
Hospitalizations per 10,000 population aged 10-17
(2020-2022)
Compared to:
UT Counties
The distribution is based on data from 22 Utah counties.
UT Value
(49.2)
The regional value is compared to the Utah State value.
Prior Value
(54.9)
Prior Value compares a measured value with the previously measured value. Confidence intervals were taken into account in determining the direction of the comparison.
Trend
This comparison measures the indicator’s values over multiple time periods.<br>The Mann-Kendall Test for Statistical Significance is used to evaluate the trend<br>over 4 to 10 periods of measure, subject to data availability and comparability.
County: Salt Lake Age-Adjusted Hospitalization Rate due to Adult Mental Health
County: Salt Lake Age-Adjusted Hospitalization Rate due to Adult Mental Health
36.9
Hospitalizations per 10,000 population 18+ years
(2020-2022)
Compared to:
UT Counties
The distribution is based on data from 25 Utah counties.
UT Value
(37.0)
The regional value is compared to the Utah State value.
Prior Value
(38.8)
Prior Value compares a measured value with the previously measured value. Confidence intervals were taken into account in determining the direction of the comparison.
Trend
This comparison measures the indicator’s values over multiple time periods.<br>The Mann-Kendall Test for Statistical Significance is used to evaluate the trend<br>over 4 to 10 periods of measure, subject to data availability and comparability.
42.7
Hospitalizations per 10,000 population 18+ years
(2020-2022)
Compared to:
UT Counties
The distribution is based on data from 26 Utah counties.
UT Value
(40.4)
The regional value is compared to the Utah State value.
Prior Value
(46.7)
Prior Value compares a measured value with the previously measured value. Confidence intervals were taken into account in determining the direction of the comparison.
Trend
This comparison measures the indicator’s values over multiple time periods.<br>The Mann-Kendall Test for Statistical Significance is used to evaluate the trend<br>over 4 to 10 periods of measure, subject to data availability and comparability.
County: Salt Lake Age-Adjusted Hospitalization Rate due to Pediatric Mental Health
County: Salt Lake Age-Adjusted Hospitalization Rate due to Pediatric Mental Health
22.1
Hospitalizations per 10,000 population under 18 years
(2020-2022)
Compared to:
UT Counties
The distribution is based on data from 23 Utah counties.
UT Value
(20.9)
The regional value is compared to the Utah State value.
Prior Value
(23.0)
Prior Value compares a measured value with the previously measured value. Confidence intervals were taken into account in determining the direction of the comparison.
Trend
This comparison measures the indicator’s values over multiple time periods.<br>The Mann-Kendall Test for Statistical Significance is used to evaluate the trend<br>over 4 to 10 periods of measure, subject to data availability and comparability.
County: Salt Lake
Health / Older Adults
Value
Compared to:
County: Salt Lake Hospitalization Rate due to Hip Fractures Among Females 65+
County: Salt Lake Hospitalization Rate due to Hip Fractures Among Females 65+
122.5
Hospitalizations per 100,000 females 65+ years
(2020-2022)
Compared to:
UT Value
(443.6)
The regional value is compared to the Utah State value.
Prior Value
(119.0)
Prior Value compares a measured value with the previously measured value. Confidence intervals were taken into account in determining the direction of the comparison.
Trend
This comparison measures the indicator’s values over multiple time periods.<br>The Mann-Kendall Test for Statistical Significance is used to evaluate the trend<br>over 4 to 10 periods of measure, subject to data availability and comparability.
County: Salt Lake Hospitalization Rate due to Hip Fractures Among Males 65+
County: Salt Lake Hospitalization Rate due to Hip Fractures Among Males 65+
61.9
Hospitalizations per 100,000 males 65+ years
(2020-2022)
Compared to:
UT Value
(268.5)
The regional value is compared to the Utah State value.
Prior Value
(56.6)
Prior Value compares a measured value with the previously measured value. Confidence intervals were taken into account in determining the direction of the comparison.
Trend
This comparison measures the indicator’s values over multiple time periods.<br>The Mann-Kendall Test for Statistical Significance is used to evaluate the trend<br>over 4 to 10 periods of measure, subject to data availability and comparability.
County: Salt Lake
Health / Oral Health
Value
Compared to:
County: Salt Lake Age-Adjusted ER Rate due to Dental Problems
County: Salt Lake Age-Adjusted ER Rate due to Dental Problems
23.1
ER visits per 10,000 population
(2020-2022)
Compared to:
UT Counties
The distribution is based on data from 26 Utah counties.
UT Value
(22.1)
The regional value is compared to the Utah State value.
Prior Value
(23.1)
Prior Value compares a measured value with the previously measured value. Confidence intervals were taken into account in determining the direction of the comparison.
Trend
This comparison measures the indicator’s values over multiple time periods.<br>The Mann-Kendall Test for Statistical Significance is used to evaluate the trend<br>over 4 to 10 periods of measure, subject to data availability and comparability.
County: Salt Lake
Health / Other Conditions
Value
Compared to:
County: Salt Lake Age-Adjusted ER Rate due to Dehydration
County: Salt Lake Age-Adjusted ER Rate due to Dehydration
11.7
ER visits per 10,000 population 18+ years
(2020-2022)
Compared to:
UT Counties
The distribution is based on data from 25 Utah counties.
UT Value
(15.6)
The regional value is compared to the Utah State value.
Prior Value
(12.2)
Prior Value compares a measured value with the previously measured value. Confidence intervals were taken into account in determining the direction of the comparison.
Trend
This comparison measures the indicator’s values over multiple time periods.<br>The Mann-Kendall Test for Statistical Significance is used to evaluate the trend<br>over 4 to 10 periods of measure, subject to data availability and comparability.
County: Salt Lake Age-Adjusted ER Rate due to Urinary Tract Infections
County: Salt Lake Age-Adjusted ER Rate due to Urinary Tract Infections
57.6
ER visits per 10,000 population 18+ years
(2020-2022)
Compared to:
UT Counties
The distribution is based on data from 28 Utah counties.
UT Value
(62.6)
The regional value is compared to the Utah State value.
Prior Value
(55.0)
Prior Value compares a measured value with the previously measured value. Confidence intervals were taken into account in determining the direction of the comparison.
Trend
This comparison measures the indicator’s values over multiple time periods.<br>The Mann-Kendall Test for Statistical Significance is used to evaluate the trend<br>over 4 to 10 periods of measure, subject to data availability and comparability.
County: Salt Lake Age-Adjusted Hospitalization Rate due to Dehydration
County: Salt Lake Age-Adjusted Hospitalization Rate due to Dehydration
6.2
Hospitalizations per 10,000 population 18+ years
(2020-2022)
Compared to:
UT Counties
The distribution is based on data from 21 Utah counties.
UT Value
(7.1)
The regional value is compared to the Utah State value.
Prior Value
(6.5)
Prior Value compares a measured value with the previously measured value. Confidence intervals were taken into account in determining the direction of the comparison.
Trend
This comparison measures the indicator’s values over multiple time periods.<br>The Mann-Kendall Test for Statistical Significance is used to evaluate the trend<br>over 4 to 10 periods of measure, subject to data availability and comparability.
County: Salt Lake Age-Adjusted Hospitalization Rate due to Urinary Tract Infections
County: Salt Lake Age-Adjusted Hospitalization Rate due to Urinary Tract Infections
4.9
Hospitalizations per 10,000 population 18+ years
(2020-2022)
Compared to:
UT Counties
The distribution is based on data from 22 Utah counties.
UT Value
(5.2)
The regional value is compared to the Utah State value.
Prior Value
(5.3)
Prior Value compares a measured value with the previously measured value. Confidence intervals were taken into account in determining the direction of the comparison.
Trend
This comparison measures the indicator’s values over multiple time periods.<br>The Mann-Kendall Test for Statistical Significance is used to evaluate the trend<br>over 4 to 10 periods of measure, subject to data availability and comparability.
County: Salt Lake
Health / Prevention & Safety
Value
Compared to:
County: Salt Lake Age-Adjusted ER Rate due to Unintentional Falls
County: Salt Lake Age-Adjusted ER Rate due to Unintentional Falls
165.6
ER visits per 10,000 population 18+ years
(2020-2022)
Compared to:
UT Counties
The distribution is based on data from 29 Utah counties.
UT Value
(178.6)
The regional value is compared to the Utah State value.
Prior Value
(160.7)
Prior Value compares a measured value with the previously measured value. Confidence intervals were taken into account in determining the direction of the comparison.
Trend
This comparison measures the indicator’s values over multiple time periods.<br>The Mann-Kendall Test for Statistical Significance is used to evaluate the trend<br>over 4 to 10 periods of measure, subject to data availability and comparability.
County: Salt Lake Age-Adjusted Hospitalization Rate due to Unintentional Falls
County: Salt Lake Age-Adjusted Hospitalization Rate due to Unintentional Falls
37.8
Hospitalizations per 10,000 population 18+ years
(2020-2022)
Compared to:
UT Counties
The distribution is based on data from 28 Utah counties.
UT Value
(39.0)
The regional value is compared to the Utah State value.
Prior Value
(38.5)
Prior Value compares a measured value with the previously measured value. Confidence intervals were taken into account in determining the direction of the comparison.
Trend
This comparison measures the indicator’s values over multiple time periods.<br>The Mann-Kendall Test for Statistical Significance is used to evaluate the trend<br>over 4 to 10 periods of measure, subject to data availability and comparability.
County: Salt Lake
Health / Respiratory Diseases
Value
Compared to:
County: Salt Lake Age-Adjusted ER Rate due to Adult Asthma
County: Salt Lake Age-Adjusted ER Rate due to Adult Asthma
12.4
ER visits per 10,000 population 18+ years
(2020-2022)
Compared to:
UT Counties
The distribution is based on data from 23 Utah counties.
UT Value
(11.2)
The regional value is compared to the Utah State value.
Prior Value
(12.1)
Prior Value compares a measured value with the previously measured value. Confidence intervals were taken into account in determining the direction of the comparison.
Trend
This comparison measures the indicator’s values over multiple time periods.<br>The Mann-Kendall Test for Statistical Significance is used to evaluate the trend<br>over 4 to 10 periods of measure, subject to data availability and comparability.
County: Salt Lake Age-Adjusted ER Rate due to Asthma
County: Salt Lake Age-Adjusted ER Rate due to Asthma
13.0
ER visits per 10,000 population
(2020-2022)
Compared to:
UT Counties
The distribution is based on data from 24 Utah counties.
UT Value
(11.1)
The regional value is compared to the Utah State value.
Prior Value
(12.3)
Prior Value compares a measured value with the previously measured value. Confidence intervals were taken into account in determining the direction of the comparison.
Trend
This comparison measures the indicator’s values over multiple time periods.<br>The Mann-Kendall Test for Statistical Significance is used to evaluate the trend<br>over 4 to 10 periods of measure, subject to data availability and comparability.
County: Salt Lake Age-Adjusted ER Rate due to COPD
County: Salt Lake Age-Adjusted ER Rate due to COPD
8.4
ER visits per 10,000 population 18+ years
(2020-2022)
Compared to:
UT Counties
The distribution is based on data from 23 Utah counties.
UT Value
(9.6)
The regional value is compared to the Utah State value.
Prior Value
(9.0)
Prior Value compares a measured value with the previously measured value. Confidence intervals were taken into account in determining the direction of the comparison.
Trend
This comparison measures the indicator’s values over multiple time periods.<br>The Mann-Kendall Test for Statistical Significance is used to evaluate the trend<br>over 4 to 10 periods of measure, subject to data availability and comparability.
County: Salt Lake Age-Adjusted ER Rate due to Pediatric Asthma
County: Salt Lake Age-Adjusted ER Rate due to Pediatric Asthma
14.5
ER visits per 10,000 population under 18 years
(2020-2022)
Compared to:
UT Counties
(2019-2021)
The distribution is based on data from 20 Utah counties.
UT Value
(11.1)
The regional value is compared to the Utah State value.
Prior Value
(13.0)
Prior Value compares a measured value with the previously measured value. Confidence intervals were taken into account in determining the direction of the comparison.
Trend
This comparison measures the indicator’s values over multiple time periods.<br>The Mann-Kendall Test for Statistical Significance is used to evaluate the trend<br>over 4 to 10 periods of measure, subject to data availability and comparability.
County: Salt Lake Age-Adjusted Hospitalization Rate due to Adult Asthma
County: Salt Lake Age-Adjusted Hospitalization Rate due to Adult Asthma
1.9
Hospitalizations per 10,000 population 18+ years
(2020-2022)
Compared to:
UT Value
(1.5)
The regional value is compared to the Utah State value.
Prior Value
(1.8)
Prior Value compares a measured value with the previously measured value. Confidence intervals were taken into account in determining the direction of the comparison.
Trend
This comparison measures the indicator’s values over multiple time periods.<br>The Mann-Kendall Test for Statistical Significance is used to evaluate the trend<br>over 4 to 10 periods of measure, subject to data availability and comparability.
County: Salt Lake Age-Adjusted Hospitalization Rate due to Asthma
County: Salt Lake Age-Adjusted Hospitalization Rate due to Asthma
2.6
Hospitalizations per 10,000 population
(2020-2022)
Compared to:
UT Value
(2.1)
The regional value is compared to the Utah State value.
Prior Value
(2.4)
Prior Value compares a measured value with the previously measured value. Confidence intervals were taken into account in determining the direction of the comparison.
Trend
This comparison measures the indicator’s values over multiple time periods.<br>The Mann-Kendall Test for Statistical Significance is used to evaluate the trend<br>over 4 to 10 periods of measure, subject to data availability and comparability.
County: Salt Lake Age-Adjusted Hospitalization Rate due to COPD
County: Salt Lake Age-Adjusted Hospitalization Rate due to COPD
3.6
Hospitalizations per 10,000 population 18+ years
(2020-2022)
Compared to:
UT Counties
(2019-2021)
The distribution is based on data from 21 Utah counties.
UT Value
(3.6)
The regional value is compared to the Utah State value.
Prior Value
(4.0)
Prior Value compares a measured value with the previously measured value. Confidence intervals were taken into account in determining the direction of the comparison.
Trend
This comparison measures the indicator’s values over multiple time periods.<br>The Mann-Kendall Test for Statistical Significance is used to evaluate the trend<br>over 4 to 10 periods of measure, subject to data availability and comparability.
County: Salt Lake Age-Adjusted Hospitalization Rate due to Pediatric Asthma
County: Salt Lake Age-Adjusted Hospitalization Rate due to Pediatric Asthma
4.7
Hospitalizations per 10,000 population under 18 years
(2020-2022)
Compared to:
UT Value
(3.8)
The regional value is compared to the Utah State value.
Prior Value
(4.1)
Prior Value compares a measured value with the previously measured value. Confidence intervals were taken into account in determining the direction of the comparison.
Trend
This comparison measures the indicator’s values over multiple time periods.<br>The Mann-Kendall Test for Statistical Significance is used to evaluate the trend<br>over 4 to 10 periods of measure, subject to data availability and comparability.
