
Search for Indicators
Community Profiles
To view another region, select from the drop-down menu below.
The region location type is based on the Utah Department of Health's small statistical areas, which do not line up exactly with city boundaries.
Indicator Gauge Icon Legend
Legend Colors
Red is bad, green is good, blue is not statistically different/neutral.
Compared to Distribution
 the value is in the best half of communities.
 the value is in the 2nd worst quarter of communities.
 the value is in the worst quarter of communities.
Compared to Target
 meets target;
  does not meet target.
Compared to a Single Value
 lower than the comparison value;
 higher than the comparison value;
 not statistically different from comparison value.
Trend

 non-significant change over time;
 significant change over time;
  no change over time.
Compared to Prior Value
 higher than the previous measurement period;
 lower than the previous measurement period;
 no statistically different change from previous measurement period.
Region: Cottonwood
Health / Alcohol & Drug Use
Value
Compared to:
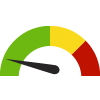
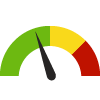
Region: Cottonwood Adults who Binge Drink
Region: Cottonwood Adults who Binge Drink
11.8%
(2020-2022)
Compared to:
UT Counties
The distribution is based on data from 23 Utah counties.
UT Value
(11.8%)
The regional value is compared to the Utah State value.
Prior Value
(10.8%)
Prior Value compares a measured value with the previously measured value. Confidence intervals were taken into account in determining the direction of the comparison.
Trend
This comparison measures the indicator’s values over multiple time periods.<br>The Mann-Kendall Test for Statistical Significance is used to evaluate the trend<br>over 4 to 10 periods of measure, subject to data availability and comparability.
Region: Cottonwood
Health / Cancer
Value
Compared to:
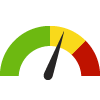
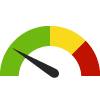
Region: Cottonwood Mammogram in Past 2 Years: 40+
Region: Cottonwood Mammogram in Past 2 Years: 40+
65.8%
(2018)
Compared to:

UT Counties
(2018-2020)
The distribution is based on data from 24 Utah counties.
UT Value
(64.2%)
The regional value is compared to the Utah State value.
Prior Value
(66.3%)
Prior Value compares a measured value with the previously measured value. Confidence intervals were taken into account in determining the direction of the comparison.
Trend
This comparison measures the indicator’s values over multiple time periods.<br>The Mann-Kendall Test for Statistical Significance is used to evaluate the trend<br>over 4 to 10 periods of measure, subject to data availability and comparability.
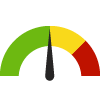
Region: Cottonwood Pap Test in Past 3 Years
Region: Cottonwood Pap Test in Past 3 Years
76.2%
(2019)
Compared to:
UT Counties
(2014)
The distribution is based on data from 20 Utah counties.
UT Value
(58.8%)
The regional value is compared to the Utah State value.
Prior Value
(59.0%)
Prior Value compares a measured value with the previously measured value. Confidence intervals were taken into account in determining the direction of the comparison.
Trend
This comparison measures the indicator’s values over multiple time periods.<br>The Mann-Kendall Test for Statistical Significance is used to evaluate the trend<br>over 4 to 10 periods of measure, subject to data availability and comparability.
Region: Cottonwood
Health / Diabetes
Value
Compared to:
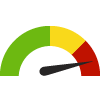
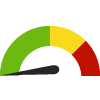
Region: Cottonwood Adults with Diabetes
Region: Cottonwood Adults with Diabetes
6.2%
(2020-2022)
Compared to:

UT Counties
The distribution is based on data from 26 Utah counties.
UT Value
(8.7%)
The regional value is compared to the Utah State value.
Prior Value
(7.4%)
Prior Value compares a measured value with the previously measured value. Confidence intervals were taken into account in determining the direction of the comparison.
Trend
This comparison measures the indicator’s values over multiple time periods.<br>The Mann-Kendall Test for Statistical Significance is used to evaluate the trend<br>over 4 to 10 periods of measure, subject to data availability and comparability.
Region: Cottonwood Age-Adjusted Death Rate due to Diabetes
Region: Cottonwood Age-Adjusted Death Rate due to Diabetes
14.3
Deaths per 100,000 population
(2019-2021)
Compared to:
UT Value
(26.9)
The regional value is compared to the Utah State value.
US Value
(24.8 in 2020)
The regional value is compared to the national value. The source for the national value is Centers for Disease Control and Prevention
Prior Value
(14.1)
Prior Value compares a measured value with the previously measured value. Confidence intervals were taken into account in determining the direction of the comparison.
Trend
This comparison measures the indicator’s values over multiple time periods.<br>The Mann-Kendall Test for Statistical Significance is used to evaluate the trend<br>over 4 to 10 periods of measure, subject to data availability and comparability.
Region: Cottonwood
Health / Health Care Access & Quality
Value
Compared to:
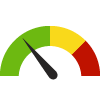
Region: Cottonwood Adults Unable to Afford to See a Doctor
Region: Cottonwood Adults Unable to Afford to See a Doctor
6.8%
(2020-2022)
Compared to:
UT Counties
The distribution is based on data from 26 Utah counties.
UT Value
(10.7%)
The regional value is compared to the Utah State value.
Prior Value
(4.3%)
Prior Value compares a measured value with the previously measured value. Confidence intervals were taken into account in determining the direction of the comparison.
Trend
This comparison measures the indicator’s values over multiple time periods.<br>The Mann-Kendall Test for Statistical Significance is used to evaluate the trend<br>over 4 to 10 periods of measure, subject to data availability and comparability.
Region: Cottonwood Adults with a Usual Source of Health Care
Region: Cottonwood Adults with a Usual Source of Health Care
82.5%
(2020-2022)
Compared to:

UT Counties
The distribution is based on data from 29 Utah counties.
UT Value
(78.7%)
The regional value is compared to the Utah State value.
Prior Value
(80.0%)
Prior Value compares a measured value with the previously measured value. Confidence intervals were taken into account in determining the direction of the comparison.
Trend
This comparison measures the indicator’s values over multiple time periods.<br>The Mann-Kendall Test for Statistical Significance is used to evaluate the trend<br>over 4 to 10 periods of measure, subject to data availability and comparability.
Region: Cottonwood
Health / Heart Disease & Stroke
Value
Compared to:
Region: Cottonwood Adults who Experienced a Heart Attack, Coronary Heart Disease, or a Stroke
Region: Cottonwood Adults who Experienced a Heart Attack, Coronary Heart Disease, or a Stroke
5.3%
(2020-2022)
Compared to:
UT Counties
The distribution is based on data from 25 Utah counties.
UT Value
(6.4%)
The regional value is compared to the Utah State value.
Prior Value
(5.0%)
Prior Value compares a measured value with the previously measured value. Confidence intervals were taken into account in determining the direction of the comparison.
Trend
This comparison measures the indicator’s values over multiple time periods.<br>The Mann-Kendall Test for Statistical Significance is used to evaluate the trend<br>over 4 to 10 periods of measure, subject to data availability and comparability.
Region: Cottonwood Age-Adjusted Death Rate due to Cerebrovascular Disease (Stroke)
Region: Cottonwood Age-Adjusted Death Rate due to Cerebrovascular Disease (Stroke)
32.3
Deaths per 100,000 population
(2019-2021)
Compared to:
UT Counties
(2017-2019)
The distribution is based on data from 20 Utah counties.
UT Value
(32.9)
The regional value is compared to the Utah State value.
US Value
(38.8 in 2020)
The regional value is compared to the national value. The source for the national value is Centers for Disease Control and Prevention
Prior Value
(35.2)
Prior Value compares a measured value with the previously measured value. Confidence intervals were taken into account in determining the direction of the comparison.
Trend
This comparison measures the indicator’s values over multiple time periods.<br>The Mann-Kendall Test for Statistical Significance is used to evaluate the trend<br>over 4 to 10 periods of measure, subject to data availability and comparability.
HP 2030 Target
(33.4)
Region: Cottonwood Age-Adjusted Death Rate due to Heart Disease
Region: Cottonwood Age-Adjusted Death Rate due to Heart Disease
120.5
Deaths per 100,000 population
(2019-2021)
Compared to:

UT Counties
(2018-2020)
The distribution is based on data from 27 Utah counties.
UT Value
(150.6)
The regional value is compared to the Utah State value.
US Value
(92.9 in 2017)
The regional value is compared to the national value. The source for the national value is Centers for Disease Control and Prevention
Prior Value
(118.1)
Prior Value compares a measured value with the previously measured value. Confidence intervals were taken into account in determining the direction of the comparison.
Trend
This comparison measures the indicator’s values over multiple time periods.<br>The Mann-Kendall Test for Statistical Significance is used to evaluate the trend<br>over 4 to 10 periods of measure, subject to data availability and comparability.
Region: Cottonwood High Blood Pressure Prevalence
Region: Cottonwood High Blood Pressure Prevalence
21.0%
(2019-2021)
Compared to:
UT Counties
The distribution is based on data from 26 Utah counties.
UT Value
(27.3%)
The regional value is compared to the Utah State value.
US Value
(32.4% in 2021)
The regional value is compared to the national value. The source for the national value is Behavioral Risk Factor Surveillance System
Prior Value
(22.8%)
Prior Value compares a measured value with the previously measured value. Confidence intervals were taken into account in determining the direction of the comparison.
Trend
This comparison measures the indicator’s values over multiple time periods.<br>The Mann-Kendall Test for Statistical Significance is used to evaluate the trend<br>over 4 to 10 periods of measure, subject to data availability and comparability.
HP 2030 Target
(41.9%)
Region: Cottonwood High Cholesterol Prevalence
Region: Cottonwood High Cholesterol Prevalence
22.1%
(2019-2021)
Compared to:
UT Counties
The distribution is based on data from 24 Utah counties.
UT Value
(24.9%)
The regional value is compared to the Utah State value.
Prior Value
(27.3%)
Prior Value compares a measured value with the previously measured value. Confidence intervals were taken into account in determining the direction of the comparison.
Trend
This comparison measures the indicator’s values over multiple time periods.<br>The Mann-Kendall Test for Statistical Significance is used to evaluate the trend<br>over 4 to 10 periods of measure, subject to data availability and comparability.
Region: Cottonwood
Health / Immunizations & Infectious Diseases
Value
Compared to:
Region: Cottonwood Adults 65+ with Pneumonia Vaccination
Region: Cottonwood Adults 65+ with Pneumonia Vaccination
76.3%
(2019-2021)
Compared to:
UT Counties
The distribution is based on data from 24 Utah counties.
UT Value
(74.6%)
The regional value is compared to the Utah State value.
Prior Value
(72.0%)
Prior Value compares a measured value with the previously measured value. Confidence intervals were taken into account in determining the direction of the comparison.
Trend
This comparison measures the indicator’s values over multiple time periods.<br>The Mann-Kendall Test for Statistical Significance is used to evaluate the trend<br>over 4 to 10 periods of measure, subject to data availability and comparability.
Region: Cottonwood Adults with Influenza Vaccination
Region: Cottonwood Adults with Influenza Vaccination
49.9%
(2020-2022)
Compared to:
UT Counties
(2022)
The distribution is based on data from 26 Utah counties.
UT Value
(43.5% in 2022)
The regional value is compared to the Utah State value.
Prior Value
(44.5%)
Prior Value compares a measured value with the previously measured value. Confidence intervals were taken into account in determining the direction of the comparison.
Region: Cottonwood Age-Adjusted Death Rate due to Influenza and Pneumonia
Region: Cottonwood Age-Adjusted Death Rate due to Influenza and Pneumonia
8.6
Deaths per 100,000 population
(2019-2021)
Compared to:
UT Value
(9.6)
The regional value is compared to the Utah State value.
US Value
(13.0 in 2020)
The regional value is compared to the national value. The source for the national value is Centers for Disease Control and Prevention
Prior Value
(8.7)
Prior Value compares a measured value with the previously measured value. Confidence intervals were taken into account in determining the direction of the comparison.
Trend
This comparison measures the indicator’s values over multiple time periods.<br>The Mann-Kendall Test for Statistical Significance is used to evaluate the trend<br>over 4 to 10 periods of measure, subject to data availability and comparability.
Region: Cottonwood
Health / Mental Health & Mental Disorders
Value
Compared to:
Region: Cottonwood Adult Days in Poor Mental Health
Region: Cottonwood Adult Days in Poor Mental Health
21.7%
(2020-2022)
Compared to:

UT Counties
The distribution is based on data from 25 Utah counties.
UT Value
(23.8%)
The regional value is compared to the Utah State value.
Prior Value
(22.3%)
Prior Value compares a measured value with the previously measured value. Confidence intervals were taken into account in determining the direction of the comparison.
Trend
This comparison measures the indicator’s values over multiple time periods.<br>The Mann-Kendall Test for Statistical Significance is used to evaluate the trend<br>over 4 to 10 periods of measure, subject to data availability and comparability.
Region: Cottonwood Adults Ever Diagnosed with Depression
Region: Cottonwood Adults Ever Diagnosed with Depression
24.1%
(2020-2022)
Compared to:
UT Counties
The distribution is based on data from 27 Utah counties.
UT Value
(24.5%)
The regional value is compared to the Utah State value.
Prior Value
(19.0%)
Prior Value compares a measured value with the previously measured value. Confidence intervals were taken into account in determining the direction of the comparison.
Trend
This comparison measures the indicator’s values over multiple time periods.<br>The Mann-Kendall Test for Statistical Significance is used to evaluate the trend<br>over 4 to 10 periods of measure, subject to data availability and comparability.
Region: Cottonwood Age-Adjusted Death Rate due to Suicide
Region: Cottonwood Age-Adjusted Death Rate due to Suicide
16.5
Deaths per 100,000 population
(2019-2021)
Compared to:
UT Value
(20.6)
The regional value is compared to the Utah State value.
US Value
(13.5 in 2020)
The regional value is compared to the national value. The source for the national value is Centers for Disease Control and Prevention
Prior Value
(20.6)
Prior Value compares a measured value with the previously measured value. Confidence intervals were taken into account in determining the direction of the comparison.
Trend
This comparison measures the indicator’s values over multiple time periods.<br>The Mann-Kendall Test for Statistical Significance is used to evaluate the trend<br>over 4 to 10 periods of measure, subject to data availability and comparability.
HP 2030 Target
(12.8)
<div>MHMD-01: Reduce the suicide rate <strong>(LEADING HEALTH INDICATOR)</strong></div>
Region: Cottonwood
Health / Older Adults
Value
Compared to:
Region: Cottonwood Age-Adjusted Death Rate due to Alzheimer's Disease
Region: Cottonwood Age-Adjusted Death Rate due to Alzheimer's Disease
40.3
Deaths per 100,000 population
(2019-2021)
Compared to:
UT Value
(39.5)
The regional value is compared to the Utah State value.
US Value
(32.4 in 2020)
The regional value is compared to the national value. The source for the national value is Centers for Disease Control and Prevention
Prior Value
(38.8)
Prior Value compares a measured value with the previously measured value. Confidence intervals were taken into account in determining the direction of the comparison.
Trend
This comparison measures the indicator’s values over multiple time periods.<br>The Mann-Kendall Test for Statistical Significance is used to evaluate the trend<br>over 4 to 10 periods of measure, subject to data availability and comparability.
Region: Cottonwood
Health / Oral Health
Value
Compared to:
Region: Cottonwood Adults who Visited a Dentist
Region: Cottonwood Adults who Visited a Dentist
71.3%
(2020)
Compared to:

UT Counties
The distribution is based on data from 23 Utah counties.
UT Value
(73.1%)
The regional value is compared to the Utah State value.
Prior Value
(75.2%)
Prior Value compares a measured value with the previously measured value. Confidence intervals were taken into account in determining the direction of the comparison.
Trend
This comparison measures the indicator’s values over multiple time periods.<br>The Mann-Kendall Test for Statistical Significance is used to evaluate the trend<br>over 4 to 10 periods of measure, subject to data availability and comparability.
Region: Cottonwood
Health / Other Conditions
Value
Compared to:
Region: Cottonwood Adults with Kidney Disease
Region: Cottonwood Adults with Kidney Disease
3.3%
(2020-2022)
Compared to:
UT Value
(2.8%)
The regional value is compared to the Utah State value.
Prior Value
(4.1%)
Prior Value compares a measured value with the previously measured value. Confidence intervals were taken into account in determining the direction of the comparison.
Trend
This comparison measures the indicator’s values over multiple time periods.<br>The Mann-Kendall Test for Statistical Significance is used to evaluate the trend<br>over 4 to 10 periods of measure, subject to data availability and comparability.
Region: Cottonwood Age-Adjusted Death Rate due to Kidney Disease
Region: Cottonwood Age-Adjusted Death Rate due to Kidney Disease
7.6
Deaths per 100,000 population
(2019-2021)
Compared to:
UT Counties
(2018-2020)
The distribution is based on data from 29 Utah counties.
UT Value
(13.3)
The regional value is compared to the Utah State value.
US Value
(12.7 in 2020)
The regional value is compared to the national value. The source for the national value is Centers for Disease Control and Prevention
Prior Value
(8.4)
Prior Value compares a measured value with the previously measured value. Confidence intervals were taken into account in determining the direction of the comparison.
Trend
This comparison measures the indicator’s values over multiple time periods.<br>The Mann-Kendall Test for Statistical Significance is used to evaluate the trend<br>over 4 to 10 periods of measure, subject to data availability and comparability.
Region: Cottonwood
Health / Physical Activity
Value
Compared to:
Region: Cottonwood Adults Engaging in Regular Physical Activity
Region: Cottonwood Adults Engaging in Regular Physical Activity
27.8%
(2017-2019)
Compared to:
UT Counties
The distribution is based on data from 23 Utah counties.
UT Value
(23.9%)
The regional value is compared to the Utah State value.
Prior Value
(30.2%)
Prior Value compares a measured value with the previously measured value. Confidence intervals were taken into account in determining the direction of the comparison.
Trend
This comparison measures the indicator’s values over multiple time periods.<br>The Mann-Kendall Test for Statistical Significance is used to evaluate the trend<br>over 4 to 10 periods of measure, subject to data availability and comparability.
HP 2030 Target
(29.7%)
<div>PA-05: Increase the proportion of adults who do enough aerobic and muscle-strengthening activity <strong>(LEADING HEALTH INDICATOR)</strong></div>
Region: Cottonwood
Health / Prevention & Safety
Value
Compared to:
Region: Cottonwood Age-Adjusted Death Rate due to Falls
Region: Cottonwood Age-Adjusted Death Rate due to Falls
11.3
Deaths per 100,000 population
(2019-2021)
Compared to:
UT Value
(13.8)
The regional value is compared to the Utah State value.
US Value
(10.3 in 2020)
The regional value is compared to the national value. The source for the national value is Centers for Disease Control and Prevention
Prior Value
(11.2)
Prior Value compares a measured value with the previously measured value. Confidence intervals were taken into account in determining the direction of the comparison.
Trend
This comparison measures the indicator’s values over multiple time periods.<br>The Mann-Kendall Test for Statistical Significance is used to evaluate the trend<br>over 4 to 10 periods of measure, subject to data availability and comparability.
Region: Cottonwood Age-Adjusted Death Rate due to Unintentional Injuries
Region: Cottonwood Age-Adjusted Death Rate due to Unintentional Injuries
38.7
Deaths per 100,000 population
(2019-2021)
Compared to:
UT Counties
(2018-2020)
The distribution is based on data from 23 Utah counties.
UT Value
(48.6)
The regional value is compared to the Utah State value.
US Value
(57.6 in 2020)
The regional value is compared to the national value. The source for the national value is Centers for Disease Control and Prevention
Prior Value
(29.5)
Prior Value compares a measured value with the previously measured value. Confidence intervals were taken into account in determining the direction of the comparison.
Trend
This comparison measures the indicator’s values over multiple time periods.<br>The Mann-Kendall Test for Statistical Significance is used to evaluate the trend<br>over 4 to 10 periods of measure, subject to data availability and comparability.
HP 2030 Target
(43.2)
Region: Cottonwood
Health / Respiratory Diseases
Value
Compared to:
Region: Cottonwood Adults with COPD
Region: Cottonwood Adults with COPD
3.2%
Percent of adults
(2019-2021)
Compared to:
UT Counties
(2017-2019)
The distribution is based on data from 23 Utah counties.
UT Value
(4.3%)
The regional value is compared to the Utah State value.
Prior Value
(2.8%)
Prior Value compares a measured value with the previously measured value. Confidence intervals were taken into account in determining the direction of the comparison.
Trend
This comparison measures the indicator’s values over multiple time periods.<br>The Mann-Kendall Test for Statistical Significance is used to evaluate the trend<br>over 4 to 10 periods of measure, subject to data availability and comparability.
Region: Cottonwood Adults with Current Asthma
Region: Cottonwood Adults with Current Asthma
8.6%
(2020-2022)
Compared to:
UT Counties
The distribution is based on data from 23 Utah counties.
UT Value
(10.5%)
The regional value is compared to the Utah State value.
Prior Value
(7.9%)
Prior Value compares a measured value with the previously measured value. Confidence intervals were taken into account in determining the direction of the comparison.
Trend
This comparison measures the indicator’s values over multiple time periods.<br>The Mann-Kendall Test for Statistical Significance is used to evaluate the trend<br>over 4 to 10 periods of measure, subject to data availability and comparability.
Region: Cottonwood
Health / Tobacco Use
Value
Compared to:
Region: Cottonwood Adults who Smoke
Region: Cottonwood Adults who Smoke
5.9%
(2018-2020)
Compared to:
UT Counties
The distribution is based on data from 20 Utah counties.
UT Value
(8.5%)
The regional value is compared to the Utah State value.
Prior Value
(6.5%)
Prior Value compares a measured value with the previously measured value. Confidence intervals were taken into account in determining the direction of the comparison.
Trend
This comparison measures the indicator’s values over multiple time periods.<br>The Mann-Kendall Test for Statistical Significance is used to evaluate the trend<br>over 4 to 10 periods of measure, subject to data availability and comparability.
HP 2030 Target
(6.1%)
<div>TU-02: Reduce current cigarette smoking in adults <strong>(LEADING HEALTH INDICATOR)</strong></div>
Region: Cottonwood
Health / Weight Status
Value
Compared to:
Region: Cottonwood Adults Who Are Obese
Region: Cottonwood Adults Who Are Obese
18.3%
(2020-2022)
Compared to:
UT Counties
The distribution is based on data from 27 Utah counties.
UT Value
(31.0%)
The regional value is compared to the Utah State value.
Prior Value
(18.5%)
Prior Value compares a measured value with the previously measured value. Confidence intervals were taken into account in determining the direction of the comparison.
Trend
This comparison measures the indicator’s values over multiple time periods.<br>The Mann-Kendall Test for Statistical Significance is used to evaluate the trend<br>over 4 to 10 periods of measure, subject to data availability and comparability.
Region: Cottonwood Adults who are Overweight or Obese
Region: Cottonwood Adults who are Overweight or Obese
56.8%
(2020-2022)
Compared to:
UT Counties
The distribution is based on data from 29 Utah counties.
UT Value
(65.3%)
The regional value is compared to the Utah State value.
Prior Value
(52.7%)
Prior Value compares a measured value with the previously measured value. Confidence intervals were taken into account in determining the direction of the comparison.
Trend
This comparison measures the indicator’s values over multiple time periods.<br>The Mann-Kendall Test for Statistical Significance is used to evaluate the trend<br>over 4 to 10 periods of measure, subject to data availability and comparability.
Region: Cottonwood
Health / Wellness & Lifestyle
Value
Compared to:
Region: Cottonwood Self-Reported General Health Assessment: Good or Better
Region: Cottonwood Self-Reported General Health Assessment: Good or Better
92.8%
(2020-2022)
Compared to:
UT Counties
The distribution is based on data from 27 Utah counties.
UT Value
(87.3%)
The regional value is compared to the Utah State value.
Prior Value
(92.5%)
Prior Value compares a measured value with the previously measured value. Confidence intervals were not taken into account in determining the direction of the comparison.
Trend
This comparison measures the indicator’s values over multiple time periods.<br>The Mann-Kendall Test for Statistical Significance is used to evaluate the trend<br>over 4 to 10 periods of measure, subject to data availability and comparability.
Region: Cottonwood
Community / Public Safety
Value
Compared to:
Region: Cottonwood Adults who Wear a Seat Belt
Region: Cottonwood Adults who Wear a Seat Belt
95.0%
Percent of adults
(2015-2017)
Compared to:
UT Counties
(2016-2018)
The distribution is based on data from 27 Utah counties.
UT Value
(94.9%)
The regional value is compared to the Utah State value.
Prior Value
(94.6%)
Prior Value compares a measured value with the previously measured value. Confidence intervals were taken into account in determining the direction of the comparison.
Trend
This comparison measures the indicator’s values over multiple time periods.<br>The Mann-Kendall Test for Statistical Significance is used to evaluate the trend<br>over 4 to 10 periods of measure, subject to data availability and comparability.
Region: Cottonwood Age-Adjusted Death Rate due to Motor Vehicle Traffic Collisions
Region: Cottonwood Age-Adjusted Death Rate due to Motor Vehicle Traffic Collisions
9.3
Deaths per 100,000 population
(2019-2021)
Compared to:
UT Value
(9.8)
The regional value is compared to the Utah State value.
US Value
(12.0 in 2020)
The regional value is compared to the national value. The source for the national value is Centers for Disease Control and Prevention
HP 2030 Target
(10.1)
